Immigrants vs Immigrants from Singapore Unemployment Among Ages 16 to 19 years
COMPARE
Immigrants
Immigrants from Singapore
Unemployment Among Ages 16 to 19 years
Unemployment Among Ages 16 to 19 years Comparison
Immigrants
Immigrants from Singapore
18.3%
UNEMPLOYMENT AMONG AGES 16 TO 19 YEARS
2.7/ 100
METRIC RATING
237th/ 347
METRIC RANK
16.8%
UNEMPLOYMENT AMONG AGES 16 TO 19 YEARS
97.8/ 100
METRIC RATING
77th/ 347
METRIC RANK
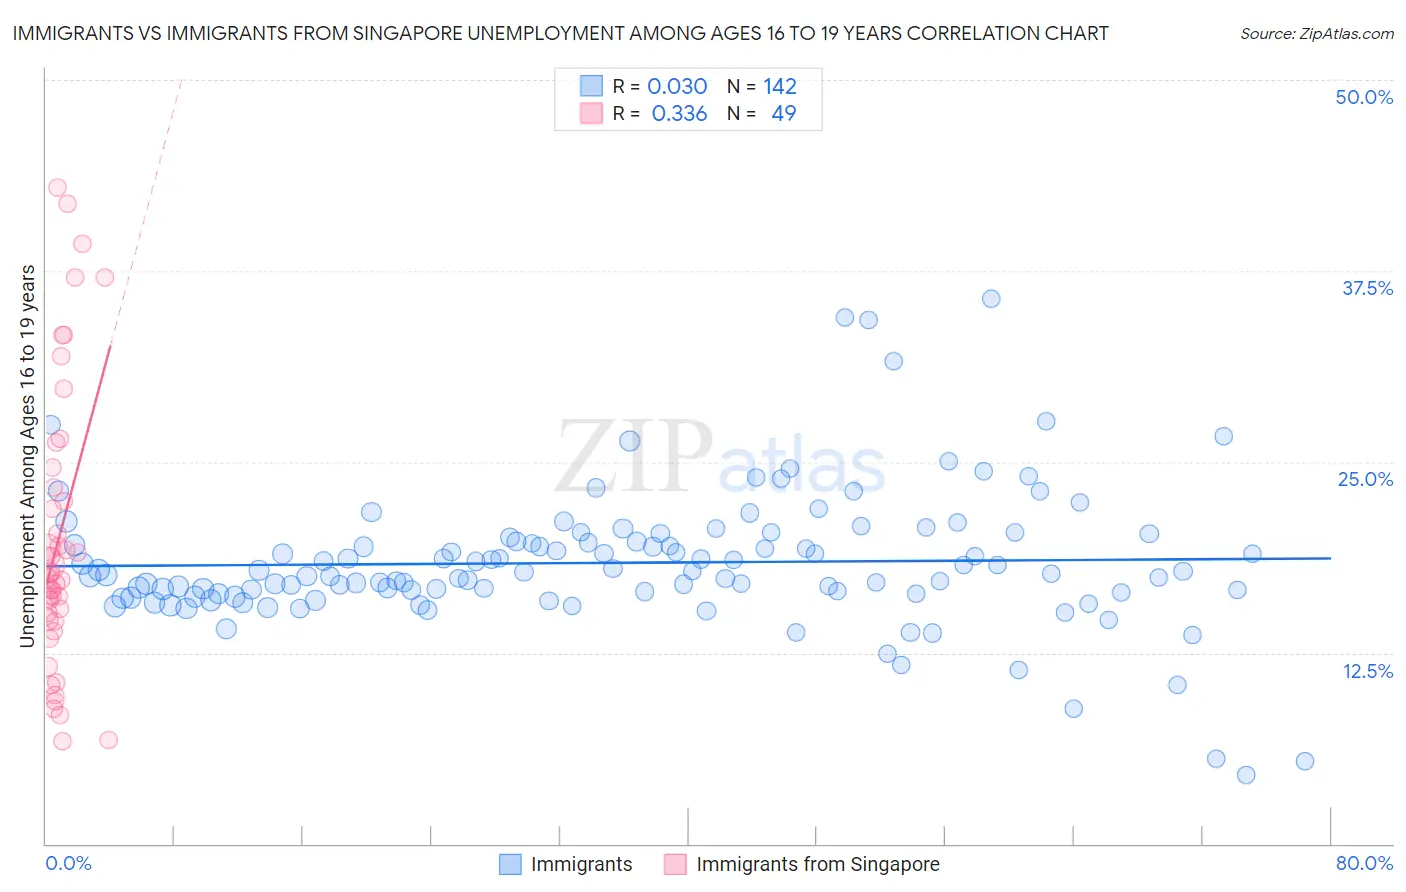
Immigrants vs Immigrants from Singapore Unemployment Among Ages 16 to 19 years Correlation Chart
The statistical analysis conducted on geographies consisting of 512,867,863 people shows no correlation between the proportion of Immigrants and unemployment rate among population between the ages 16 and 19 in the United States with a correlation coefficient (R) of 0.030 and weighted average of 18.3%. Similarly, the statistical analysis conducted on geographies consisting of 134,451,520 people shows a mild positive correlation between the proportion of Immigrants from Singapore and unemployment rate among population between the ages 16 and 19 in the United States with a correlation coefficient (R) of 0.336 and weighted average of 16.8%, a difference of 9.1%.
Unemployment Among Ages 16 to 19 years Correlation Summary
| Measurement | Immigrants | Immigrants from Singapore |
| Minimum | 4.5% | 6.7% |
| Maximum | 35.7% | 43.0% |
| Range | 31.2% | 36.3% |
| Mean | 18.4% | 19.9% |
| Median | 17.7% | 17.4% |
| Interquartile 25% (IQ1) | 16.4% | 14.6% |
| Interquartile 75% (IQ3) | 19.8% | 24.0% |
| Interquartile Range (IQR) | 3.4% | 9.4% |
| Standard Deviation (Sample) | 4.5% | 9.2% |
| Standard Deviation (Population) | 4.5% | 9.1% |
Similar Demographics by Unemployment Among Ages 16 to 19 years
Demographics Similar to Immigrants by Unemployment Among Ages 16 to 19 years
In terms of unemployment among ages 16 to 19 years, the demographic groups most similar to Immigrants are Immigrants from Colombia (18.3%, a difference of 0.020%), South American (18.3%, a difference of 0.020%), French American Indian (18.3%, a difference of 0.090%), Native Hawaiian (18.3%, a difference of 0.10%), and Immigrants from Cabo Verde (18.4%, a difference of 0.32%).
| Demographics | Rating | Rank | Unemployment Among Ages 16 to 19 years |
| Spanish Americans | 4.7 /100 | #230 | Tragic 18.2% |
| Nepalese | 4.2 /100 | #231 | Tragic 18.2% |
| Immigrants | Russia | 4.0 /100 | #232 | Tragic 18.2% |
| Seminole | 4.0 /100 | #233 | Tragic 18.2% |
| Colombians | 3.7 /100 | #234 | Tragic 18.3% |
| French American Indians | 2.9 /100 | #235 | Tragic 18.3% |
| Immigrants | Colombia | 2.7 /100 | #236 | Tragic 18.3% |
| Immigrants | Immigrants | 2.7 /100 | #237 | Tragic 18.3% |
| South Americans | 2.6 /100 | #238 | Tragic 18.3% |
| Native Hawaiians | 2.4 /100 | #239 | Tragic 18.3% |
| Immigrants | Cabo Verde | 2.0 /100 | #240 | Tragic 18.4% |
| Immigrants | Ukraine | 1.3 /100 | #241 | Tragic 18.5% |
| Moroccans | 1.1 /100 | #242 | Tragic 18.5% |
| Mexicans | 0.9 /100 | #243 | Tragic 18.5% |
| Guatemalans | 0.8 /100 | #244 | Tragic 18.6% |
Demographics Similar to Immigrants from Singapore by Unemployment Among Ages 16 to 19 years
In terms of unemployment among ages 16 to 19 years, the demographic groups most similar to Immigrants from Singapore are Soviet Union (16.8%, a difference of 0.020%), Immigrants from North America (16.8%, a difference of 0.070%), New Zealander (16.8%, a difference of 0.14%), Slovak (16.8%, a difference of 0.17%), and French Canadian (16.8%, a difference of 0.17%).
| Demographics | Rating | Rank | Unemployment Among Ages 16 to 19 years |
| Austrians | 98.6 /100 | #70 | Exceptional 16.7% |
| Latvians | 98.5 /100 | #71 | Exceptional 16.7% |
| Immigrants | Canada | 98.5 /100 | #72 | Exceptional 16.7% |
| Lithuanians | 98.2 /100 | #73 | Exceptional 16.7% |
| Immigrants | Eastern Africa | 98.1 /100 | #74 | Exceptional 16.8% |
| New Zealanders | 98.0 /100 | #75 | Exceptional 16.8% |
| Immigrants | North America | 97.9 /100 | #76 | Exceptional 16.8% |
| Immigrants | Singapore | 97.8 /100 | #77 | Exceptional 16.8% |
| Soviet Union | 97.8 /100 | #78 | Exceptional 16.8% |
| Slovaks | 97.5 /100 | #79 | Exceptional 16.8% |
| French Canadians | 97.5 /100 | #80 | Exceptional 16.8% |
| Immigrants | Latvia | 97.5 /100 | #81 | Exceptional 16.8% |
| Whites/Caucasians | 97.5 /100 | #82 | Exceptional 16.8% |
| Ugandans | 97.4 /100 | #83 | Exceptional 16.8% |
| French | 97.4 /100 | #84 | Exceptional 16.8% |