Immigrants vs Immigrants from Malaysia Unemployment Among Seniors over 65 years
COMPARE
Immigrants
Immigrants from Malaysia
Unemployment Among Seniors over 65 years
Unemployment Among Seniors over 65 years Comparison
Immigrants
Immigrants from Malaysia
5.4%
UNEMPLOYMENT AMONG SENIORS OVER 65 YEARS
0.6/ 100
METRIC RATING
249th/ 347
METRIC RANK
5.0%
UNEMPLOYMENT AMONG SENIORS OVER 65 YEARS
92.7/ 100
METRIC RATING
109th/ 347
METRIC RANK
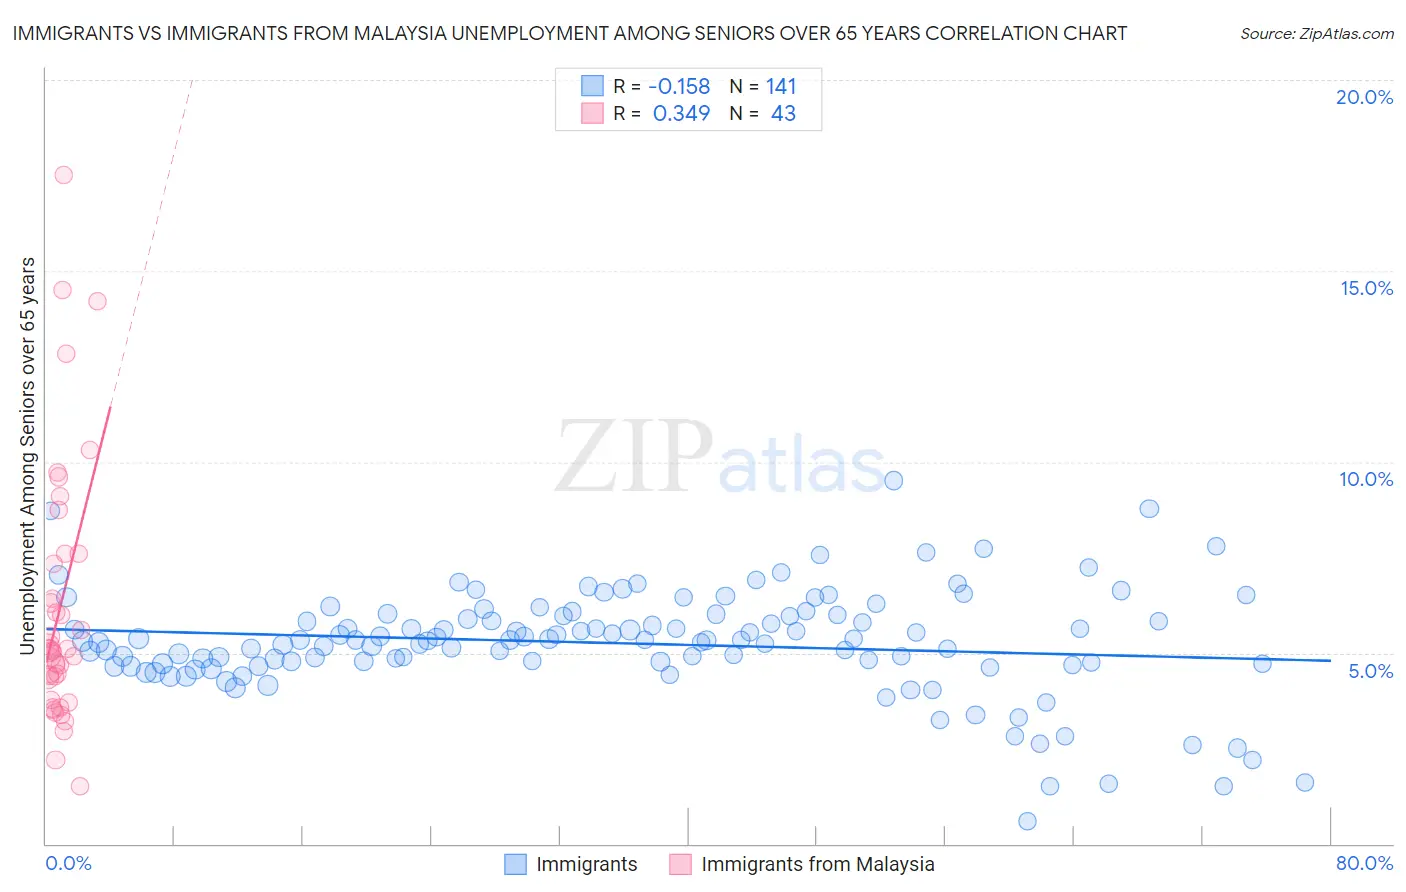
Immigrants vs Immigrants from Malaysia Unemployment Among Seniors over 65 years Correlation Chart
The statistical analysis conducted on geographies consisting of 464,359,515 people shows a poor negative correlation between the proportion of Immigrants and unemployment rate amomg seniors over the age of 65 in the United States with a correlation coefficient (R) of -0.158 and weighted average of 5.4%. Similarly, the statistical analysis conducted on geographies consisting of 188,822,333 people shows a mild positive correlation between the proportion of Immigrants from Malaysia and unemployment rate amomg seniors over the age of 65 in the United States with a correlation coefficient (R) of 0.349 and weighted average of 5.0%, a difference of 6.2%.
Unemployment Among Seniors over 65 years Correlation Summary
| Measurement | Immigrants | Immigrants from Malaysia |
| Minimum | 0.60% | 1.5% |
| Maximum | 9.5% | 17.5% |
| Range | 8.9% | 16.0% |
| Mean | 5.3% | 6.2% |
| Median | 5.3% | 5.0% |
| Interquartile 25% (IQ1) | 4.7% | 3.8% |
| Interquartile 75% (IQ3) | 6.0% | 7.6% |
| Interquartile Range (IQR) | 1.3% | 3.8% |
| Standard Deviation (Sample) | 1.4% | 3.5% |
| Standard Deviation (Population) | 1.4% | 3.4% |
Similar Demographics by Unemployment Among Seniors over 65 years
Demographics Similar to Immigrants by Unemployment Among Seniors over 65 years
In terms of unemployment among seniors over 65 years, the demographic groups most similar to Immigrants are Ghanaian (5.4%, a difference of 0.0%), West Indian (5.4%, a difference of 0.010%), French Canadian (5.4%, a difference of 0.020%), Immigrants from Caribbean (5.3%, a difference of 0.080%), and Trinidadian and Tobagonian (5.4%, a difference of 0.080%).
| Demographics | Rating | Rank | Unemployment Among Seniors over 65 years |
| Bahamians | 0.9 /100 | #242 | Tragic 5.3% |
| Nigerians | 0.9 /100 | #243 | Tragic 5.3% |
| Peruvians | 0.8 /100 | #244 | Tragic 5.3% |
| Ottawa | 0.8 /100 | #245 | Tragic 5.3% |
| Colombians | 0.7 /100 | #246 | Tragic 5.3% |
| Immigrants | Caribbean | 0.7 /100 | #247 | Tragic 5.3% |
| French Canadians | 0.7 /100 | #248 | Tragic 5.4% |
| Immigrants | Immigrants | 0.6 /100 | #249 | Tragic 5.4% |
| Ghanaians | 0.6 /100 | #250 | Tragic 5.4% |
| West Indians | 0.6 /100 | #251 | Tragic 5.4% |
| Trinidadians and Tobagonians | 0.6 /100 | #252 | Tragic 5.4% |
| Immigrants | Sierra Leone | 0.6 /100 | #253 | Tragic 5.4% |
| Paraguayans | 0.5 /100 | #254 | Tragic 5.4% |
| Immigrants | Peru | 0.5 /100 | #255 | Tragic 5.4% |
| Moroccans | 0.5 /100 | #256 | Tragic 5.4% |
Demographics Similar to Immigrants from Malaysia by Unemployment Among Seniors over 65 years
In terms of unemployment among seniors over 65 years, the demographic groups most similar to Immigrants from Malaysia are Immigrants from Saudi Arabia (5.0%, a difference of 0.010%), Immigrants from Vietnam (5.0%, a difference of 0.020%), Immigrants from Germany (5.0%, a difference of 0.050%), Finnish (5.0%, a difference of 0.070%), and Eastern European (5.0%, a difference of 0.090%).
| Demographics | Rating | Rank | Unemployment Among Seniors over 65 years |
| Immigrants | Thailand | 95.4 /100 | #102 | Exceptional 5.0% |
| Immigrants | Lithuania | 95.1 /100 | #103 | Exceptional 5.0% |
| Immigrants | Scotland | 95.0 /100 | #104 | Exceptional 5.0% |
| Okinawans | 94.7 /100 | #105 | Exceptional 5.0% |
| Immigrants | Turkey | 94.3 /100 | #106 | Exceptional 5.0% |
| Immigrants | Germany | 93.2 /100 | #107 | Exceptional 5.0% |
| Immigrants | Vietnam | 92.9 /100 | #108 | Exceptional 5.0% |
| Immigrants | Malaysia | 92.7 /100 | #109 | Exceptional 5.0% |
| Immigrants | Saudi Arabia | 92.7 /100 | #110 | Exceptional 5.0% |
| Finns | 92.2 /100 | #111 | Exceptional 5.0% |
| Eastern Europeans | 92.0 /100 | #112 | Exceptional 5.0% |
| Seminole | 91.4 /100 | #113 | Exceptional 5.0% |
| Immigrants | Latvia | 91.4 /100 | #114 | Exceptional 5.0% |
| Celtics | 91.3 /100 | #115 | Exceptional 5.0% |
| Immigrants | Korea | 91.0 /100 | #116 | Exceptional 5.0% |