Immigrants vs Immigrants from Australia Unemployment Among Women with Children Under 6 years
COMPARE
Immigrants
Immigrants from Australia
Unemployment Among Women with Children Under 6 years
Unemployment Among Women with Children Under 6 years Comparison
Immigrants
Immigrants from Australia
7.8%
UNEMPLOYMENT AMONG WOMEN WITH CHILDREN UNDER 6 YEARS
21.4/ 100
METRIC RATING
205th/ 347
METRIC RANK
6.8%
UNEMPLOYMENT AMONG WOMEN WITH CHILDREN UNDER 6 YEARS
99.9/ 100
METRIC RATING
45th/ 347
METRIC RANK
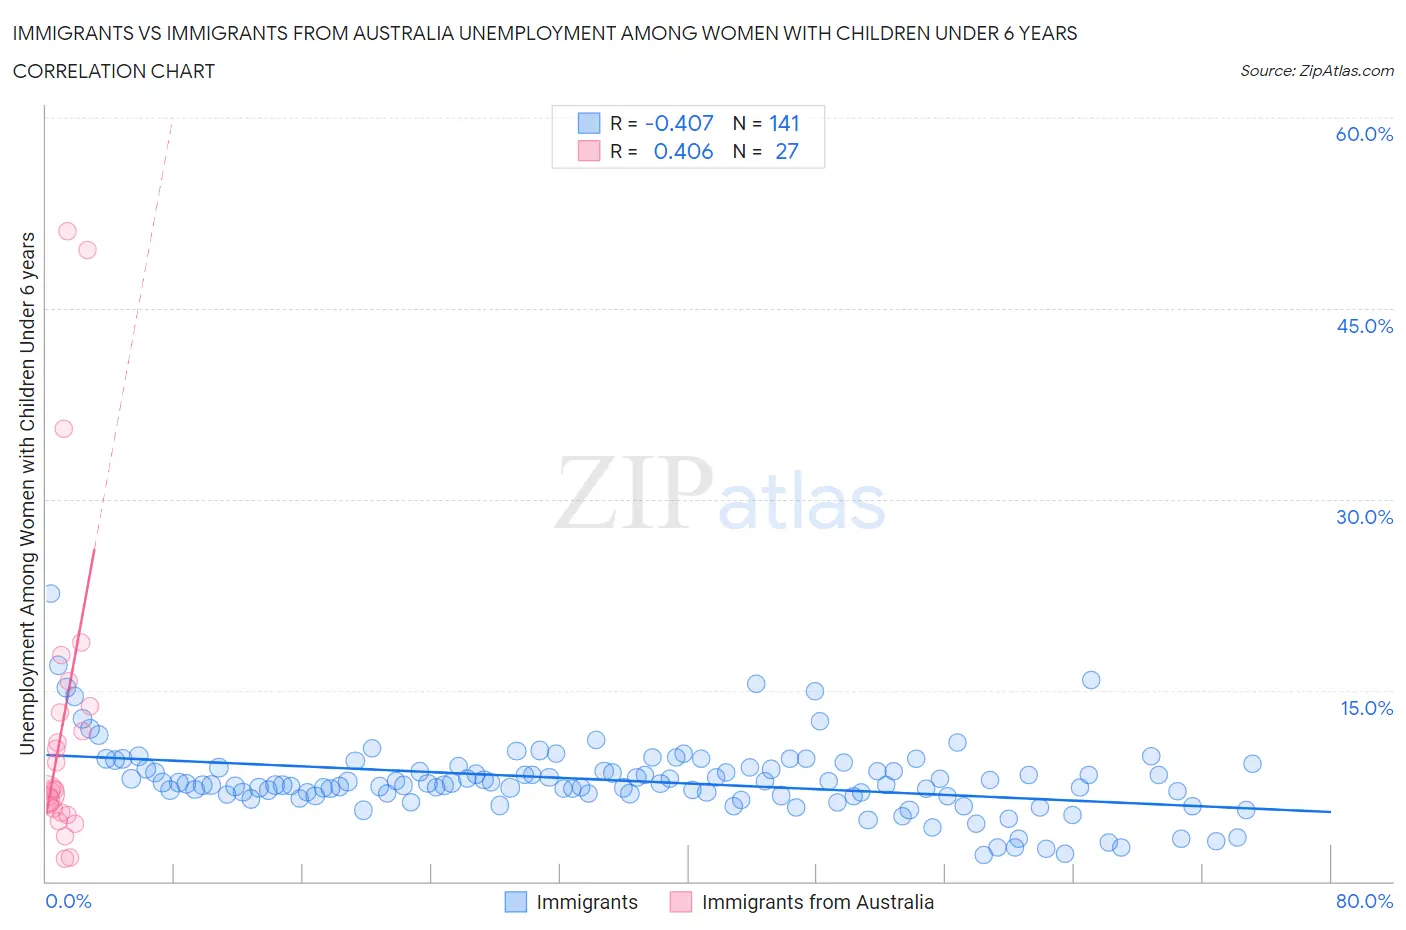
Immigrants vs Immigrants from Australia Unemployment Among Women with Children Under 6 years Correlation Chart
The statistical analysis conducted on geographies consisting of 380,514,538 people shows a moderate negative correlation between the proportion of Immigrants and unemployment rate among women with children under the age of 6 in the United States with a correlation coefficient (R) of -0.407 and weighted average of 7.8%. Similarly, the statistical analysis conducted on geographies consisting of 185,332,554 people shows a moderate positive correlation between the proportion of Immigrants from Australia and unemployment rate among women with children under the age of 6 in the United States with a correlation coefficient (R) of 0.406 and weighted average of 6.8%, a difference of 15.7%.
Unemployment Among Women with Children Under 6 years Correlation Summary
| Measurement | Immigrants | Immigrants from Australia |
| Minimum | 2.1% | 1.8% |
| Maximum | 22.6% | 51.1% |
| Range | 20.5% | 49.3% |
| Mean | 7.9% | 12.5% |
| Median | 7.7% | 7.2% |
| Interquartile 25% (IQ1) | 6.8% | 5.4% |
| Interquartile 75% (IQ3) | 8.8% | 13.7% |
| Interquartile Range (IQR) | 2.1% | 8.3% |
| Standard Deviation (Sample) | 2.9% | 12.9% |
| Standard Deviation (Population) | 2.9% | 12.6% |
Similar Demographics by Unemployment Among Women with Children Under 6 years
Demographics Similar to Immigrants by Unemployment Among Women with Children Under 6 years
In terms of unemployment among women with children under 6 years, the demographic groups most similar to Immigrants are Hungarian (7.8%, a difference of 0.020%), Canadian (7.8%, a difference of 0.070%), Lebanese (7.8%, a difference of 0.080%), Spaniard (7.8%, a difference of 0.18%), and Sudanese (7.8%, a difference of 0.20%).
| Demographics | Rating | Rank | Unemployment Among Women with Children Under 6 years |
| Lithuanians | 30.0 /100 | #198 | Fair 7.8% |
| Immigrants | Poland | 27.3 /100 | #199 | Fair 7.8% |
| Guamanians/Chamorros | 25.5 /100 | #200 | Fair 7.8% |
| Basques | 24.7 /100 | #201 | Fair 7.8% |
| Sudanese | 23.5 /100 | #202 | Fair 7.8% |
| Spaniards | 23.3 /100 | #203 | Fair 7.8% |
| Lebanese | 22.2 /100 | #204 | Fair 7.8% |
| Immigrants | Immigrants | 21.4 /100 | #205 | Fair 7.8% |
| Hungarians | 21.2 /100 | #206 | Fair 7.8% |
| Canadians | 20.6 /100 | #207 | Fair 7.8% |
| Immigrants | Syria | 18.9 /100 | #208 | Poor 7.8% |
| Costa Ricans | 17.6 /100 | #209 | Poor 7.8% |
| Poles | 16.0 /100 | #210 | Poor 7.9% |
| Immigrants | Ecuador | 14.9 /100 | #211 | Poor 7.9% |
| Swiss | 12.3 /100 | #212 | Poor 7.9% |
Demographics Similar to Immigrants from Australia by Unemployment Among Women with Children Under 6 years
In terms of unemployment among women with children under 6 years, the demographic groups most similar to Immigrants from Australia are Iranian (6.7%, a difference of 0.060%), Latvian (6.8%, a difference of 0.24%), Immigrants from Asia (6.8%, a difference of 0.41%), Immigrants from Switzerland (6.8%, a difference of 0.44%), and Immigrants from Nepal (6.8%, a difference of 0.49%).
| Demographics | Rating | Rank | Unemployment Among Women with Children Under 6 years |
| Hmong | 100.0 /100 | #38 | Exceptional 6.7% |
| Immigrants | Russia | 100.0 /100 | #39 | Exceptional 6.7% |
| Asians | 100.0 /100 | #40 | Exceptional 6.7% |
| Immigrants | Indonesia | 99.9 /100 | #41 | Exceptional 6.7% |
| Immigrants | Cuba | 99.9 /100 | #42 | Exceptional 6.7% |
| Bhutanese | 99.9 /100 | #43 | Exceptional 6.7% |
| Iranians | 99.9 /100 | #44 | Exceptional 6.7% |
| Immigrants | Australia | 99.9 /100 | #45 | Exceptional 6.8% |
| Latvians | 99.9 /100 | #46 | Exceptional 6.8% |
| Immigrants | Asia | 99.9 /100 | #47 | Exceptional 6.8% |
| Immigrants | Switzerland | 99.9 /100 | #48 | Exceptional 6.8% |
| Immigrants | Nepal | 99.9 /100 | #49 | Exceptional 6.8% |
| Immigrants | Ireland | 99.9 /100 | #50 | Exceptional 6.8% |
| Ethiopians | 99.9 /100 | #51 | Exceptional 6.8% |
| Immigrants | Iran | 99.9 /100 | #52 | Exceptional 6.8% |