Immigrants from Zimbabwe vs Marshallese Unemployment Among Ages 16 to 19 years
COMPARE
Immigrants from Zimbabwe
Marshallese
Unemployment Among Ages 16 to 19 years
Unemployment Among Ages 16 to 19 years Comparison
Immigrants from Zimbabwe
Marshallese
16.3%
UNEMPLOYMENT AMONG AGES 16 TO 19 YEARS
99.7/ 100
METRIC RATING
44th/ 347
METRIC RANK
17.6%
UNEMPLOYMENT AMONG AGES 16 TO 19 YEARS
41.7/ 100
METRIC RATING
190th/ 347
METRIC RANK
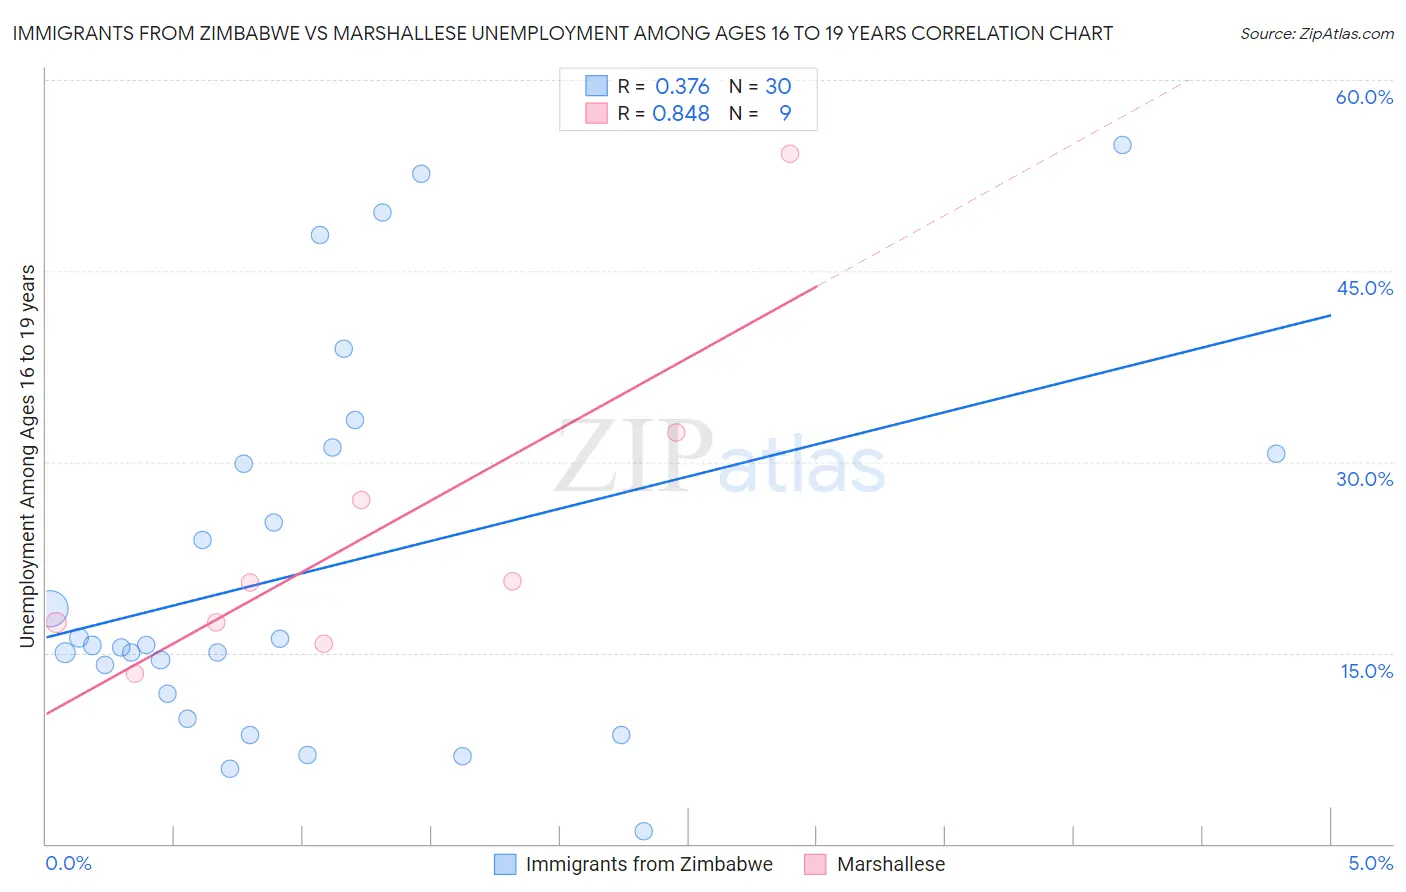
Immigrants from Zimbabwe vs Marshallese Unemployment Among Ages 16 to 19 years Correlation Chart
The statistical analysis conducted on geographies consisting of 115,703,102 people shows a mild positive correlation between the proportion of Immigrants from Zimbabwe and unemployment rate among population between the ages 16 and 19 in the United States with a correlation coefficient (R) of 0.376 and weighted average of 16.3%. Similarly, the statistical analysis conducted on geographies consisting of 14,627,426 people shows a very strong positive correlation between the proportion of Marshallese and unemployment rate among population between the ages 16 and 19 in the United States with a correlation coefficient (R) of 0.848 and weighted average of 17.6%, a difference of 7.9%.
Unemployment Among Ages 16 to 19 years Correlation Summary
| Measurement | Immigrants from Zimbabwe | Marshallese |
| Minimum | 1.0% | 13.3% |
| Maximum | 54.9% | 54.2% |
| Range | 53.9% | 40.9% |
| Mean | 21.6% | 24.3% |
| Median | 15.6% | 20.5% |
| Interquartile 25% (IQ1) | 11.8% | 16.5% |
| Interquartile 75% (IQ3) | 30.6% | 29.6% |
| Interquartile Range (IQR) | 18.8% | 13.1% |
| Standard Deviation (Sample) | 14.8% | 12.7% |
| Standard Deviation (Population) | 14.5% | 11.9% |
Similar Demographics by Unemployment Among Ages 16 to 19 years
Demographics Similar to Immigrants from Zimbabwe by Unemployment Among Ages 16 to 19 years
In terms of unemployment among ages 16 to 19 years, the demographic groups most similar to Immigrants from Zimbabwe are Polish (16.4%, a difference of 0.020%), Immigrants from North Macedonia (16.4%, a difference of 0.040%), Immigrants from Vietnam (16.4%, a difference of 0.11%), Immigrants from Lebanon (16.3%, a difference of 0.13%), and Maltese (16.4%, a difference of 0.15%).
| Demographics | Rating | Rank | Unemployment Among Ages 16 to 19 years |
| Immigrants | Congo | 99.8 /100 | #37 | Exceptional 16.3% |
| Bulgarians | 99.8 /100 | #38 | Exceptional 16.3% |
| Croatians | 99.8 /100 | #39 | Exceptional 16.3% |
| Hmong | 99.8 /100 | #40 | Exceptional 16.3% |
| Immigrants | Nepal | 99.8 /100 | #41 | Exceptional 16.3% |
| Fijians | 99.8 /100 | #42 | Exceptional 16.3% |
| Immigrants | Lebanon | 99.8 /100 | #43 | Exceptional 16.3% |
| Immigrants | Zimbabwe | 99.7 /100 | #44 | Exceptional 16.3% |
| Poles | 99.7 /100 | #45 | Exceptional 16.4% |
| Immigrants | North Macedonia | 99.7 /100 | #46 | Exceptional 16.4% |
| Immigrants | Vietnam | 99.7 /100 | #47 | Exceptional 16.4% |
| Maltese | 99.7 /100 | #48 | Exceptional 16.4% |
| Iraqis | 99.7 /100 | #49 | Exceptional 16.4% |
| Bhutanese | 99.6 /100 | #50 | Exceptional 16.4% |
| Lebanese | 99.6 /100 | #51 | Exceptional 16.4% |
Demographics Similar to Marshallese by Unemployment Among Ages 16 to 19 years
In terms of unemployment among ages 16 to 19 years, the demographic groups most similar to Marshallese are Immigrants from Europe (17.6%, a difference of 0.010%), Immigrants from Nicaragua (17.6%, a difference of 0.020%), Immigrants from Costa Rica (17.6%, a difference of 0.020%), Immigrants from Micronesia (17.6%, a difference of 0.030%), and Immigrants from Philippines (17.7%, a difference of 0.050%).
| Demographics | Rating | Rank | Unemployment Among Ages 16 to 19 years |
| Immigrants | Uruguay | 44.6 /100 | #183 | Average 17.6% |
| Eastern Europeans | 44.3 /100 | #184 | Average 17.6% |
| Iroquois | 43.4 /100 | #185 | Average 17.6% |
| Japanese | 43.2 /100 | #186 | Average 17.6% |
| Immigrants | Micronesia | 42.4 /100 | #187 | Average 17.6% |
| Immigrants | Nicaragua | 42.2 /100 | #188 | Average 17.6% |
| Immigrants | Europe | 41.8 /100 | #189 | Average 17.6% |
| Marshallese | 41.7 /100 | #190 | Average 17.6% |
| Immigrants | Costa Rica | 41.3 /100 | #191 | Average 17.6% |
| Immigrants | Philippines | 40.7 /100 | #192 | Average 17.7% |
| Immigrants | Australia | 40.6 /100 | #193 | Average 17.7% |
| Peruvians | 38.8 /100 | #194 | Fair 17.7% |
| Immigrants | Peru | 37.3 /100 | #195 | Fair 17.7% |
| Alaskan Athabascans | 34.1 /100 | #196 | Fair 17.7% |
| Immigrants | Czechoslovakia | 29.8 /100 | #197 | Fair 17.8% |