Immigrants from Zimbabwe vs Immigrants from Bangladesh Unemployment Among Ages 30 to 34 years
COMPARE
Immigrants from Zimbabwe
Immigrants from Bangladesh
Unemployment Among Ages 30 to 34 years
Unemployment Among Ages 30 to 34 years Comparison
Immigrants from Zimbabwe
Immigrants from Bangladesh
5.1%
UNEMPLOYMENT AMONG AGES 30 TO 34 YEARS
96.7/ 100
METRIC RATING
66th/ 347
METRIC RANK
6.4%
UNEMPLOYMENT AMONG AGES 30 TO 34 YEARS
0.0/ 100
METRIC RATING
284th/ 347
METRIC RANK
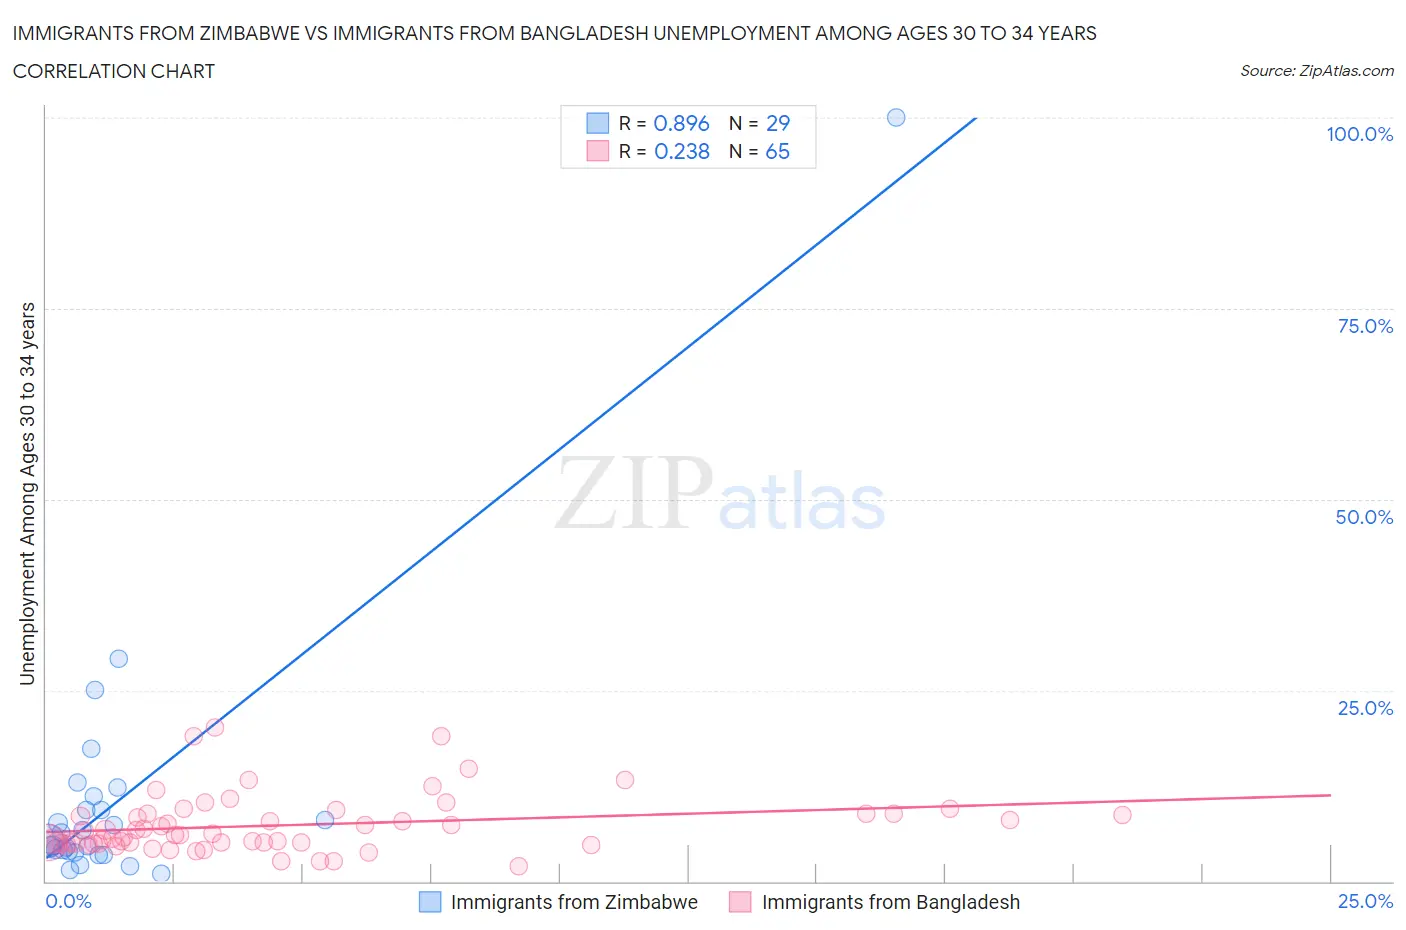
Immigrants from Zimbabwe vs Immigrants from Bangladesh Unemployment Among Ages 30 to 34 years Correlation Chart
The statistical analysis conducted on geographies consisting of 115,837,082 people shows a very strong positive correlation between the proportion of Immigrants from Zimbabwe and unemployment rate among population between the ages 30 and 34 in the United States with a correlation coefficient (R) of 0.896 and weighted average of 5.1%. Similarly, the statistical analysis conducted on geographies consisting of 199,135,967 people shows a weak positive correlation between the proportion of Immigrants from Bangladesh and unemployment rate among population between the ages 30 and 34 in the United States with a correlation coefficient (R) of 0.238 and weighted average of 6.4%, a difference of 24.9%.
Unemployment Among Ages 30 to 34 years Correlation Summary
| Measurement | Immigrants from Zimbabwe | Immigrants from Bangladesh |
| Minimum | 1.0% | 2.0% |
| Maximum | 100.0% | 20.2% |
| Range | 99.0% | 18.2% |
| Mean | 10.9% | 7.3% |
| Median | 5.3% | 6.0% |
| Interquartile 25% (IQ1) | 3.9% | 4.9% |
| Interquartile 75% (IQ3) | 10.2% | 8.9% |
| Interquartile Range (IQR) | 6.3% | 3.9% |
| Standard Deviation (Sample) | 18.3% | 3.8% |
| Standard Deviation (Population) | 18.0% | 3.8% |
Similar Demographics by Unemployment Among Ages 30 to 34 years
Demographics Similar to Immigrants from Zimbabwe by Unemployment Among Ages 30 to 34 years
In terms of unemployment among ages 30 to 34 years, the demographic groups most similar to Immigrants from Zimbabwe are Immigrants from Japan (5.1%, a difference of 0.070%), Burmese (5.1%, a difference of 0.13%), Immigrants from Eastern Asia (5.1%, a difference of 0.14%), Jordanian (5.1%, a difference of 0.14%), and Immigrants from Northern Africa (5.1%, a difference of 0.15%).
| Demographics | Rating | Rank | Unemployment Among Ages 30 to 34 years |
| Swedes | 97.1 /100 | #59 | Exceptional 5.1% |
| Immigrants | Somalia | 97.1 /100 | #60 | Exceptional 5.1% |
| Indians (Asian) | 97.0 /100 | #61 | Exceptional 5.1% |
| Immigrants | France | 97.0 /100 | #62 | Exceptional 5.1% |
| Belgians | 97.0 /100 | #63 | Exceptional 5.1% |
| Immigrants | Eastern Asia | 96.9 /100 | #64 | Exceptional 5.1% |
| Immigrants | Japan | 96.8 /100 | #65 | Exceptional 5.1% |
| Immigrants | Zimbabwe | 96.7 /100 | #66 | Exceptional 5.1% |
| Burmese | 96.5 /100 | #67 | Exceptional 5.1% |
| Jordanians | 96.5 /100 | #68 | Exceptional 5.1% |
| Immigrants | Northern Africa | 96.4 /100 | #69 | Exceptional 5.1% |
| Immigrants | Iraq | 96.4 /100 | #70 | Exceptional 5.1% |
| Paraguayans | 96.4 /100 | #71 | Exceptional 5.1% |
| Immigrants | Moldova | 96.4 /100 | #72 | Exceptional 5.1% |
| Slovenes | 96.2 /100 | #73 | Exceptional 5.2% |
Demographics Similar to Immigrants from Bangladesh by Unemployment Among Ages 30 to 34 years
In terms of unemployment among ages 30 to 34 years, the demographic groups most similar to Immigrants from Bangladesh are Hispanic or Latino (6.4%, a difference of 0.060%), African (6.4%, a difference of 0.090%), Choctaw (6.4%, a difference of 0.10%), Central American Indian (6.4%, a difference of 0.14%), and Immigrants from West Indies (6.4%, a difference of 0.17%).
| Demographics | Rating | Rank | Unemployment Among Ages 30 to 34 years |
| Immigrants | Ecuador | 0.0 /100 | #277 | Tragic 6.3% |
| Osage | 0.0 /100 | #278 | Tragic 6.3% |
| Cree | 0.0 /100 | #279 | Tragic 6.4% |
| Cherokee | 0.0 /100 | #280 | Tragic 6.4% |
| Immigrants | Caribbean | 0.0 /100 | #281 | Tragic 6.4% |
| Africans | 0.0 /100 | #282 | Tragic 6.4% |
| Hispanics or Latinos | 0.0 /100 | #283 | Tragic 6.4% |
| Immigrants | Bangladesh | 0.0 /100 | #284 | Tragic 6.4% |
| Choctaw | 0.0 /100 | #285 | Tragic 6.4% |
| Central American Indians | 0.0 /100 | #286 | Tragic 6.4% |
| Immigrants | West Indies | 0.0 /100 | #287 | Tragic 6.4% |
| Senegalese | 0.0 /100 | #288 | Tragic 6.4% |
| Menominee | 0.0 /100 | #289 | Tragic 6.4% |
| Immigrants | Trinidad and Tobago | 0.0 /100 | #290 | Tragic 6.5% |
| Jamaicans | 0.0 /100 | #291 | Tragic 6.5% |