Immigrants from Zaire vs Immigrants from Ireland Unemployment Among Ages 55 to 59 years
COMPARE
Immigrants from Zaire
Immigrants from Ireland
Unemployment Among Ages 55 to 59 years
Unemployment Among Ages 55 to 59 years Comparison
Immigrants from Zaire
Immigrants from Ireland
4.5%
UNEMPLOYMENT AMONG AGES 55 TO 59 YEARS
99.8/ 100
METRIC RATING
46th/ 347
METRIC RANK
5.0%
UNEMPLOYMENT AMONG AGES 55 TO 59 YEARS
4.8/ 100
METRIC RATING
223rd/ 347
METRIC RANK
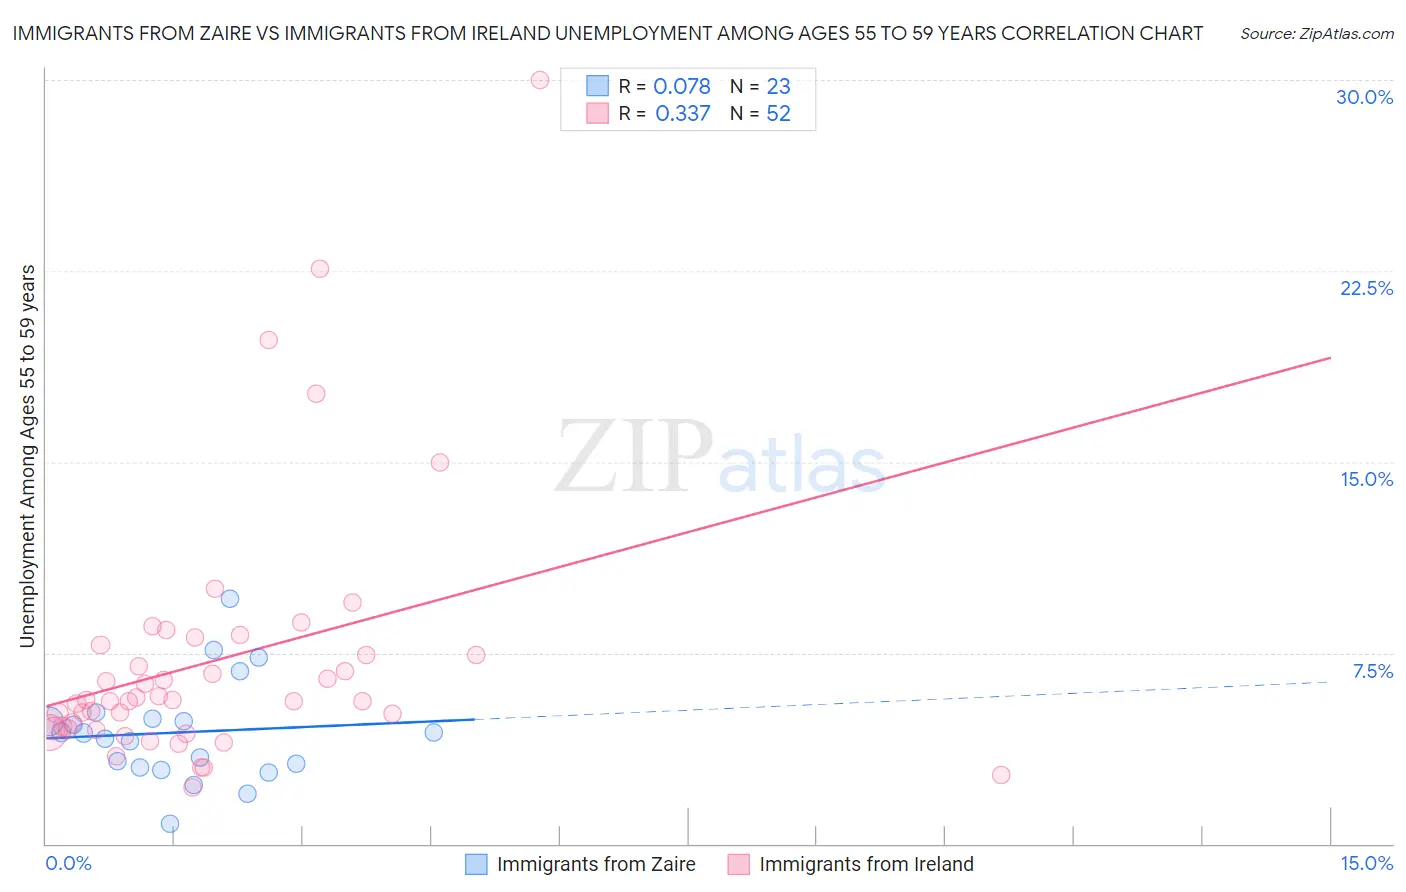
Immigrants from Zaire vs Immigrants from Ireland Unemployment Among Ages 55 to 59 years Correlation Chart
The statistical analysis conducted on geographies consisting of 104,895,493 people shows a slight positive correlation between the proportion of Immigrants from Zaire and unemployment rate among population between the ages 55 and 59 in the United States with a correlation coefficient (R) of 0.078 and weighted average of 4.5%. Similarly, the statistical analysis conducted on geographies consisting of 231,716,113 people shows a mild positive correlation between the proportion of Immigrants from Ireland and unemployment rate among population between the ages 55 and 59 in the United States with a correlation coefficient (R) of 0.337 and weighted average of 5.0%, a difference of 9.9%.
Unemployment Among Ages 55 to 59 years Correlation Summary
| Measurement | Immigrants from Zaire | Immigrants from Ireland |
| Minimum | 0.81% | 2.2% |
| Maximum | 9.6% | 30.0% |
| Range | 8.8% | 27.8% |
| Mean | 4.4% | 7.2% |
| Median | 4.4% | 5.6% |
| Interquartile 25% (IQ1) | 3.0% | 4.5% |
| Interquartile 75% (IQ3) | 4.9% | 7.6% |
| Interquartile Range (IQR) | 1.9% | 3.1% |
| Standard Deviation (Sample) | 2.0% | 5.1% |
| Standard Deviation (Population) | 1.9% | 5.1% |
Similar Demographics by Unemployment Among Ages 55 to 59 years
Demographics Similar to Immigrants from Zaire by Unemployment Among Ages 55 to 59 years
In terms of unemployment among ages 55 to 59 years, the demographic groups most similar to Immigrants from Zaire are British (4.5%, a difference of 0.020%), German Russian (4.5%, a difference of 0.060%), Immigrants from Korea (4.5%, a difference of 0.090%), European (4.5%, a difference of 0.090%), and Immigrants from Kuwait (4.5%, a difference of 0.13%).
| Demographics | Rating | Rank | Unemployment Among Ages 55 to 59 years |
| English | 99.9 /100 | #39 | Exceptional 4.5% |
| Swiss | 99.8 /100 | #40 | Exceptional 4.5% |
| Luxembourgers | 99.8 /100 | #41 | Exceptional 4.5% |
| Immigrants | Kuwait | 99.8 /100 | #42 | Exceptional 4.5% |
| Immigrants | Korea | 99.8 /100 | #43 | Exceptional 4.5% |
| Europeans | 99.8 /100 | #44 | Exceptional 4.5% |
| British | 99.8 /100 | #45 | Exceptional 4.5% |
| Immigrants | Zaire | 99.8 /100 | #46 | Exceptional 4.5% |
| German Russians | 99.8 /100 | #47 | Exceptional 4.5% |
| Immigrants | Moldova | 99.7 /100 | #48 | Exceptional 4.5% |
| Immigrants | Saudi Arabia | 99.7 /100 | #49 | Exceptional 4.5% |
| Immigrants | Pakistan | 99.7 /100 | #50 | Exceptional 4.5% |
| Maltese | 99.7 /100 | #51 | Exceptional 4.5% |
| Scottish | 99.7 /100 | #52 | Exceptional 4.5% |
| Immigrants | Middle Africa | 99.7 /100 | #53 | Exceptional 4.5% |
Demographics Similar to Immigrants from Ireland by Unemployment Among Ages 55 to 59 years
In terms of unemployment among ages 55 to 59 years, the demographic groups most similar to Immigrants from Ireland are Spanish (5.0%, a difference of 0.070%), Subsaharan African (5.0%, a difference of 0.070%), Costa Rican (5.0%, a difference of 0.090%), Immigrants from China (5.0%, a difference of 0.13%), and Immigrants from Iran (5.0%, a difference of 0.26%).
| Demographics | Rating | Rank | Unemployment Among Ages 55 to 59 years |
| Spanish Americans | 8.1 /100 | #216 | Tragic 4.9% |
| Immigrants | Brazil | 8.1 /100 | #217 | Tragic 4.9% |
| Immigrants | Austria | 8.0 /100 | #218 | Tragic 4.9% |
| Immigrants | Nigeria | 8.0 /100 | #219 | Tragic 4.9% |
| Indians (Asian) | 7.6 /100 | #220 | Tragic 4.9% |
| Nigerians | 7.5 /100 | #221 | Tragic 4.9% |
| Spanish | 5.1 /100 | #222 | Tragic 5.0% |
| Immigrants | Ireland | 4.8 /100 | #223 | Tragic 5.0% |
| Sub-Saharan Africans | 4.4 /100 | #224 | Tragic 5.0% |
| Costa Ricans | 4.4 /100 | #225 | Tragic 5.0% |
| Immigrants | China | 4.2 /100 | #226 | Tragic 5.0% |
| Immigrants | Iran | 3.7 /100 | #227 | Tragic 5.0% |
| Immigrants | Liberia | 3.2 /100 | #228 | Tragic 5.0% |
| Immigrants | Western Asia | 3.0 /100 | #229 | Tragic 5.0% |
| Immigrants | Syria | 2.7 /100 | #230 | Tragic 5.0% |