Immigrants from Zaire vs Fijian Unemployment Among Ages 60 to 64 years
COMPARE
Immigrants from Zaire
Fijian
Unemployment Among Ages 60 to 64 years
Unemployment Among Ages 60 to 64 years Comparison
Immigrants from Zaire
Fijians
4.4%
UNEMPLOYMENT AMONG AGES 60 TO 64 YEARS
100.0/ 100
METRIC RATING
23rd/ 347
METRIC RANK
3.9%
UNEMPLOYMENT AMONG AGES 60 TO 64 YEARS
100.0/ 100
METRIC RATING
2nd/ 347
METRIC RANK
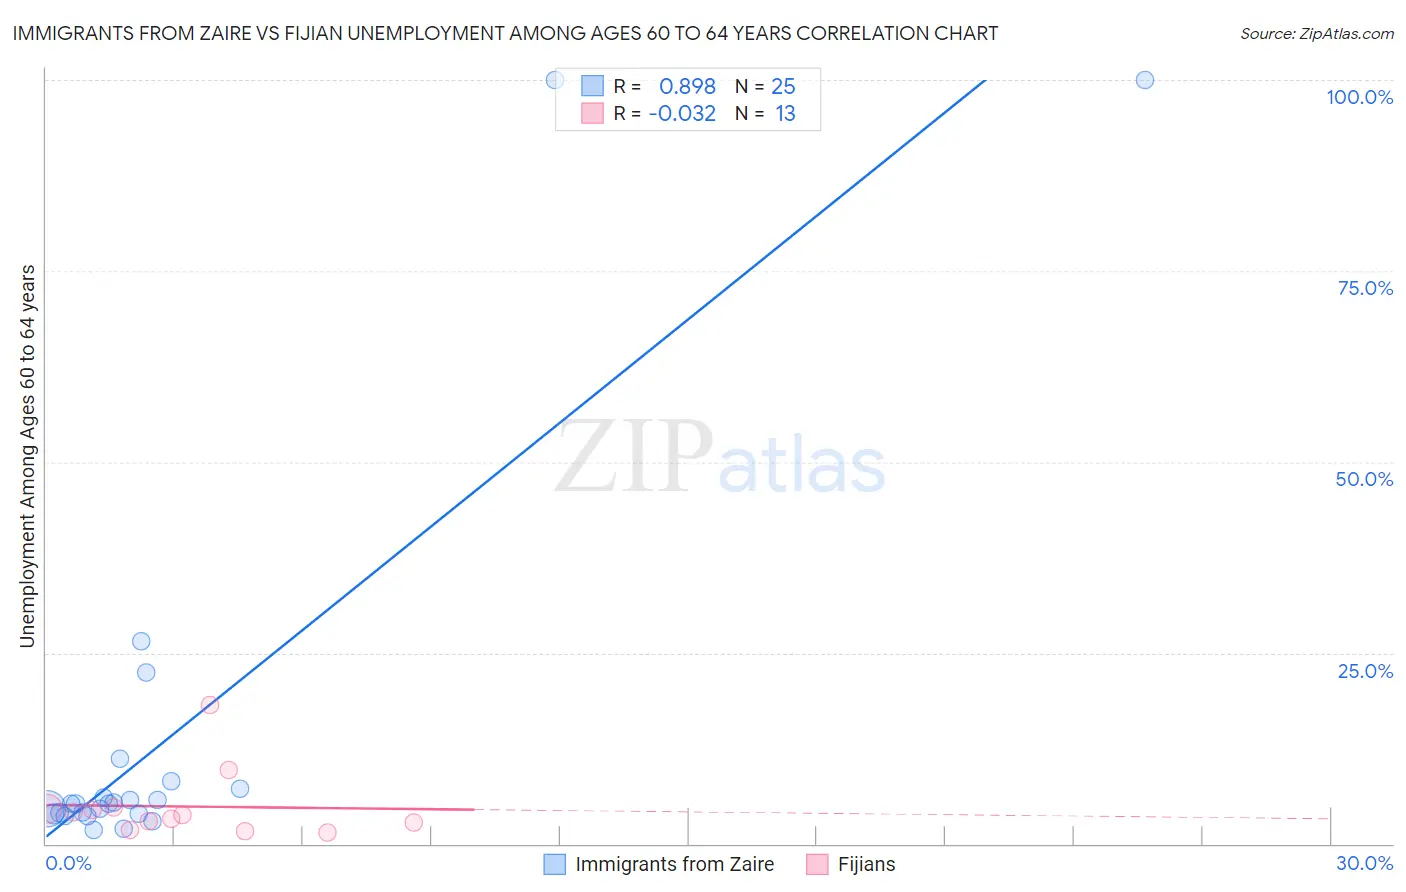
Immigrants from Zaire vs Fijian Unemployment Among Ages 60 to 64 years Correlation Chart
The statistical analysis conducted on geographies consisting of 103,576,748 people shows a very strong positive correlation between the proportion of Immigrants from Zaire and unemployment rate among population between the ages 60 and 64 in the United States with a correlation coefficient (R) of 0.898 and weighted average of 4.4%. Similarly, the statistical analysis conducted on geographies consisting of 53,532,695 people shows no correlation between the proportion of Fijians and unemployment rate among population between the ages 60 and 64 in the United States with a correlation coefficient (R) of -0.032 and weighted average of 3.9%, a difference of 13.4%.
Unemployment Among Ages 60 to 64 years Correlation Summary
| Measurement | Immigrants from Zaire | Fijian |
| Minimum | 1.8% | 1.5% |
| Maximum | 100.0% | 18.1% |
| Range | 98.2% | 16.6% |
| Mean | 14.1% | 4.9% |
| Median | 5.2% | 3.8% |
| Interquartile 25% (IQ1) | 4.0% | 2.3% |
| Interquartile 75% (IQ3) | 7.7% | 4.6% |
| Interquartile Range (IQR) | 3.7% | 2.3% |
| Standard Deviation (Sample) | 26.5% | 4.5% |
| Standard Deviation (Population) | 25.9% | 4.3% |
Similar Demographics by Unemployment Among Ages 60 to 64 years
Demographics Similar to Immigrants from Zaire by Unemployment Among Ages 60 to 64 years
In terms of unemployment among ages 60 to 64 years, the demographic groups most similar to Immigrants from Zaire are Cape Verdean (4.4%, a difference of 0.20%), Immigrants from Burma/Myanmar (4.4%, a difference of 0.23%), Afghan (4.4%, a difference of 0.28%), Immigrants from Cabo Verde (4.4%, a difference of 0.28%), and Tsimshian (4.4%, a difference of 0.43%).
| Demographics | Rating | Rank | Unemployment Among Ages 60 to 64 years |
| Danes | 100.0 /100 | #16 | Exceptional 4.4% |
| Immigrants | Afghanistan | 100.0 /100 | #17 | Exceptional 4.4% |
| Slovenes | 100.0 /100 | #18 | Exceptional 4.4% |
| Tsimshian | 100.0 /100 | #19 | Exceptional 4.4% |
| Afghans | 100.0 /100 | #20 | Exceptional 4.4% |
| Immigrants | Cabo Verde | 100.0 /100 | #21 | Exceptional 4.4% |
| Cape Verdeans | 100.0 /100 | #22 | Exceptional 4.4% |
| Immigrants | Zaire | 100.0 /100 | #23 | Exceptional 4.4% |
| Immigrants | Burma/Myanmar | 100.0 /100 | #24 | Exceptional 4.4% |
| Yugoslavians | 100.0 /100 | #25 | Exceptional 4.4% |
| Czechs | 100.0 /100 | #26 | Exceptional 4.4% |
| Immigrants | Iraq | 100.0 /100 | #27 | Exceptional 4.5% |
| Immigrants | Nepal | 100.0 /100 | #28 | Exceptional 4.5% |
| Cubans | 100.0 /100 | #29 | Exceptional 4.5% |
| Immigrants | Venezuela | 100.0 /100 | #30 | Exceptional 4.5% |
Demographics Similar to Fijians by Unemployment Among Ages 60 to 64 years
In terms of unemployment among ages 60 to 64 years, the demographic groups most similar to Fijians are Chinese (4.0%, a difference of 2.9%), Hmong (4.0%, a difference of 3.3%), Immigrants from the Azores (4.0%, a difference of 3.3%), Marshallese (3.7%, a difference of 3.7%), and Immigrants from Congo (4.1%, a difference of 6.2%).
| Demographics | Rating | Rank | Unemployment Among Ages 60 to 64 years |
| Marshallese | 100.0 /100 | #1 | Exceptional 3.7% |
| Fijians | 100.0 /100 | #2 | Exceptional 3.9% |
| Chinese | 100.0 /100 | #3 | Exceptional 4.0% |
| Hmong | 100.0 /100 | #4 | Exceptional 4.0% |
| Immigrants | Azores | 100.0 /100 | #5 | Exceptional 4.0% |
| Immigrants | Congo | 100.0 /100 | #6 | Exceptional 4.1% |
| Lumbee | 100.0 /100 | #7 | Exceptional 4.2% |
| Immigrants | Micronesia | 100.0 /100 | #8 | Exceptional 4.2% |
| Indonesians | 100.0 /100 | #9 | Exceptional 4.2% |
| Immigrants | Bosnia and Herzegovina | 100.0 /100 | #10 | Exceptional 4.2% |
| Luxembourgers | 100.0 /100 | #11 | Exceptional 4.3% |
| Immigrants | Cuba | 100.0 /100 | #12 | Exceptional 4.3% |
| Chickasaw | 100.0 /100 | #13 | Exceptional 4.3% |
| Norwegians | 100.0 /100 | #14 | Exceptional 4.3% |
| Sudanese | 100.0 /100 | #15 | Exceptional 4.3% |