Immigrants from Yemen vs Immigrants from Southern Europe Unemployment Among Ages 25 to 29 years
COMPARE
Immigrants from Yemen
Immigrants from Southern Europe
Unemployment Among Ages 25 to 29 years
Unemployment Among Ages 25 to 29 years Comparison
Immigrants from Yemen
Immigrants from Southern Europe
8.0%
UNEMPLOYMENT AMONG AGES 25 TO 29 YEARS
0.0/ 100
METRIC RATING
303rd/ 347
METRIC RANK
6.8%
UNEMPLOYMENT AMONG AGES 25 TO 29 YEARS
24.6/ 100
METRIC RATING
198th/ 347
METRIC RANK
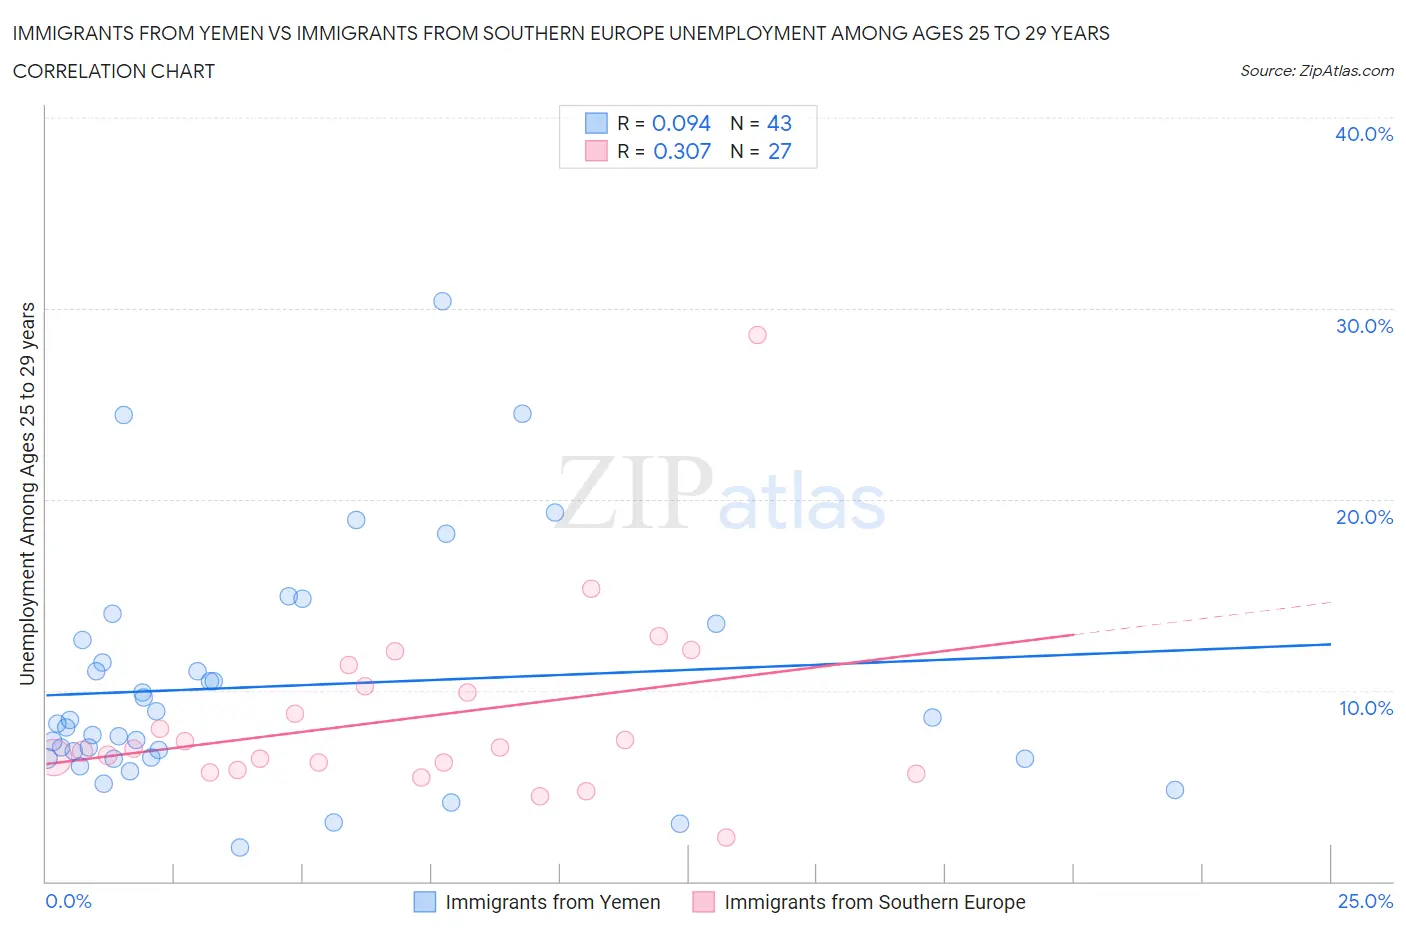
Immigrants from Yemen vs Immigrants from Southern Europe Unemployment Among Ages 25 to 29 years Correlation Chart
The statistical analysis conducted on geographies consisting of 81,785,794 people shows a slight positive correlation between the proportion of Immigrants from Yemen and unemployment rate among population between the ages 25 and 29 in the United States with a correlation coefficient (R) of 0.094 and weighted average of 8.0%. Similarly, the statistical analysis conducted on geographies consisting of 381,533,960 people shows a mild positive correlation between the proportion of Immigrants from Southern Europe and unemployment rate among population between the ages 25 and 29 in the United States with a correlation coefficient (R) of 0.307 and weighted average of 6.8%, a difference of 18.2%.
Unemployment Among Ages 25 to 29 years Correlation Summary
| Measurement | Immigrants from Yemen | Immigrants from Southern Europe |
| Minimum | 1.8% | 2.3% |
| Maximum | 30.4% | 28.6% |
| Range | 28.6% | 26.3% |
| Mean | 10.2% | 8.5% |
| Median | 8.3% | 7.0% |
| Interquartile 25% (IQ1) | 6.4% | 5.8% |
| Interquartile 75% (IQ3) | 12.6% | 10.2% |
| Interquartile Range (IQR) | 6.2% | 4.4% |
| Standard Deviation (Sample) | 6.1% | 5.0% |
| Standard Deviation (Population) | 6.0% | 4.9% |
Similar Demographics by Unemployment Among Ages 25 to 29 years
Demographics Similar to Immigrants from Yemen by Unemployment Among Ages 25 to 29 years
In terms of unemployment among ages 25 to 29 years, the demographic groups most similar to Immigrants from Yemen are Cajun (8.0%, a difference of 0.22%), Tsimshian (8.0%, a difference of 0.48%), Haitian (8.0%, a difference of 0.56%), Immigrants from Barbados (8.0%, a difference of 0.72%), and Jamaican (7.9%, a difference of 0.94%).
| Demographics | Rating | Rank | Unemployment Among Ages 25 to 29 years |
| Immigrants | West Indies | 0.0 /100 | #296 | Tragic 7.8% |
| Blackfeet | 0.0 /100 | #297 | Tragic 7.9% |
| Immigrants | Trinidad and Tobago | 0.0 /100 | #298 | Tragic 7.9% |
| Barbadians | 0.0 /100 | #299 | Tragic 7.9% |
| Central American Indians | 0.0 /100 | #300 | Tragic 7.9% |
| West Indians | 0.0 /100 | #301 | Tragic 7.9% |
| Jamaicans | 0.0 /100 | #302 | Tragic 7.9% |
| Immigrants | Yemen | 0.0 /100 | #303 | Tragic 8.0% |
| Cajuns | 0.0 /100 | #304 | Tragic 8.0% |
| Tsimshian | 0.0 /100 | #305 | Tragic 8.0% |
| Haitians | 0.0 /100 | #306 | Tragic 8.0% |
| Immigrants | Barbados | 0.0 /100 | #307 | Tragic 8.0% |
| Immigrants | Jamaica | 0.0 /100 | #308 | Tragic 8.1% |
| Immigrants | Haiti | 0.0 /100 | #309 | Tragic 8.1% |
| U.S. Virgin Islanders | 0.0 /100 | #310 | Tragic 8.1% |
Demographics Similar to Immigrants from Southern Europe by Unemployment Among Ages 25 to 29 years
In terms of unemployment among ages 25 to 29 years, the demographic groups most similar to Immigrants from Southern Europe are Guamanian/Chamorro (6.8%, a difference of 0.020%), South American Indian (6.8%, a difference of 0.10%), Italian (6.8%, a difference of 0.16%), Basque (6.8%, a difference of 0.17%), and Hungarian (6.8%, a difference of 0.18%).
| Demographics | Rating | Rank | Unemployment Among Ages 25 to 29 years |
| Chickasaw | 28.7 /100 | #191 | Fair 6.7% |
| Immigrants | Ukraine | 28.6 /100 | #192 | Fair 6.7% |
| Alsatians | 28.1 /100 | #193 | Fair 6.7% |
| Immigrants | Greece | 28.0 /100 | #194 | Fair 6.7% |
| Immigrants | Western Asia | 27.3 /100 | #195 | Fair 6.7% |
| Hungarians | 26.8 /100 | #196 | Fair 6.8% |
| Italians | 26.5 /100 | #197 | Fair 6.8% |
| Immigrants | Southern Europe | 24.6 /100 | #198 | Fair 6.8% |
| Guamanians/Chamorros | 24.3 /100 | #199 | Fair 6.8% |
| South American Indians | 23.3 /100 | #200 | Fair 6.8% |
| Basques | 22.5 /100 | #201 | Fair 6.8% |
| Immigrants | Argentina | 21.6 /100 | #202 | Fair 6.8% |
| Immigrants | Norway | 21.2 /100 | #203 | Fair 6.8% |
| Scotch-Irish | 20.0 /100 | #204 | Poor 6.8% |
| Immigrants | England | 19.8 /100 | #205 | Poor 6.8% |