Immigrants from Yemen vs Immigrants from Northern Africa Unemployment Among Ages 55 to 59 years
COMPARE
Immigrants from Yemen
Immigrants from Northern Africa
Unemployment Among Ages 55 to 59 years
Unemployment Among Ages 55 to 59 years Comparison
Immigrants from Yemen
Immigrants from Northern Africa
6.9%
UNEMPLOYMENT AMONG AGES 55 TO 59 YEARS
0.0/ 100
METRIC RATING
338th/ 347
METRIC RANK
4.8%
UNEMPLOYMENT AMONG AGES 55 TO 59 YEARS
69.8/ 100
METRIC RATING
150th/ 347
METRIC RANK
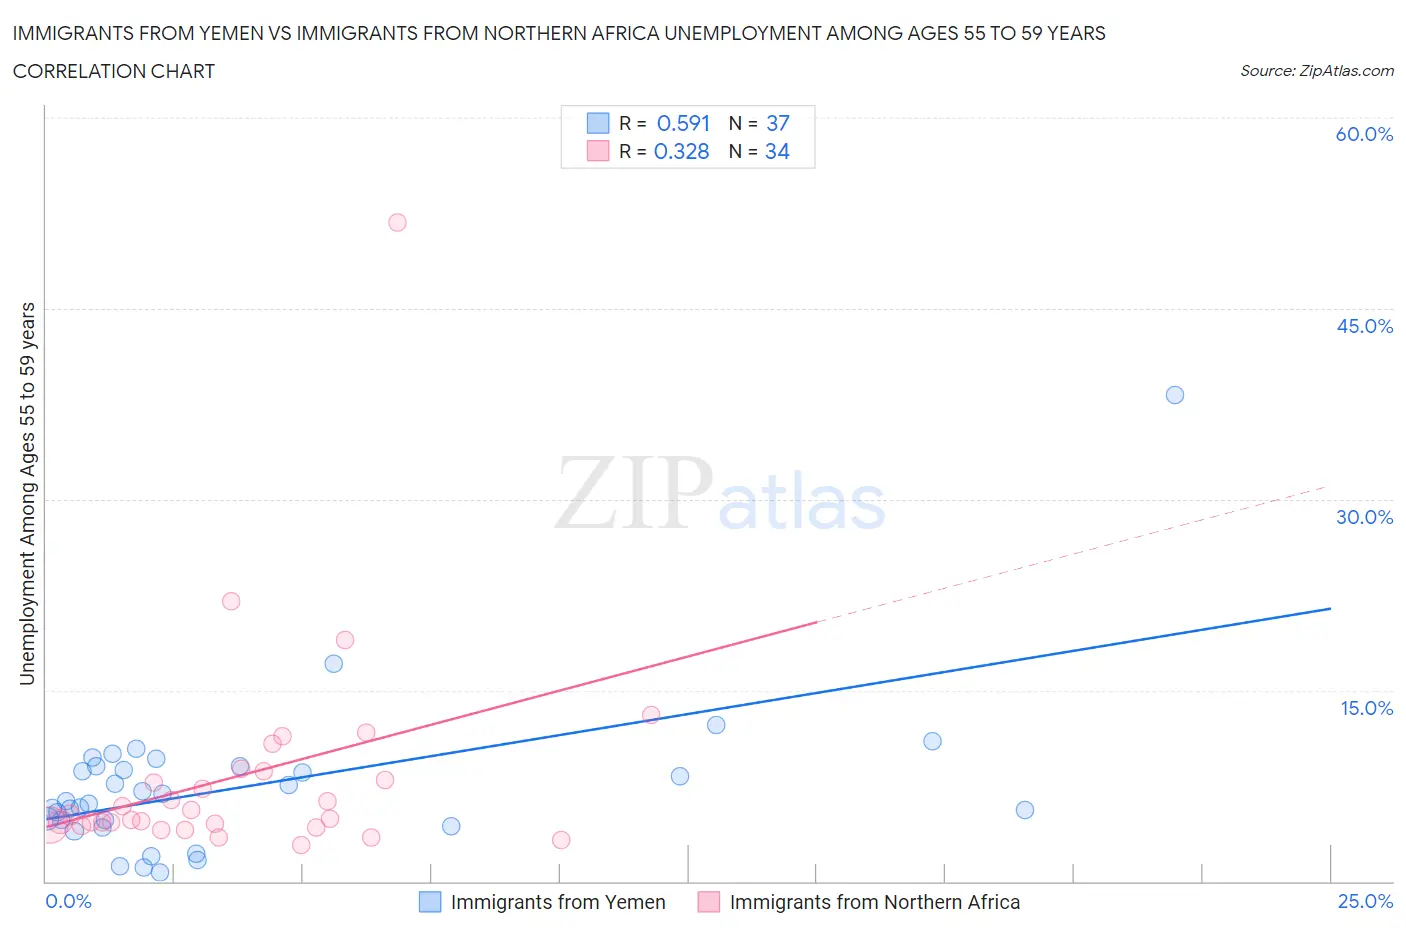
Immigrants from Yemen vs Immigrants from Northern Africa Unemployment Among Ages 55 to 59 years Correlation Chart
The statistical analysis conducted on geographies consisting of 81,145,677 people shows a substantial positive correlation between the proportion of Immigrants from Yemen and unemployment rate among population between the ages 55 and 59 in the United States with a correlation coefficient (R) of 0.591 and weighted average of 6.9%. Similarly, the statistical analysis conducted on geographies consisting of 306,075,168 people shows a mild positive correlation between the proportion of Immigrants from Northern Africa and unemployment rate among population between the ages 55 and 59 in the United States with a correlation coefficient (R) of 0.328 and weighted average of 4.8%, a difference of 44.2%.
Unemployment Among Ages 55 to 59 years Correlation Summary
| Measurement | Immigrants from Yemen | Immigrants from Northern Africa |
| Minimum | 0.70% | 2.9% |
| Maximum | 38.2% | 51.8% |
| Range | 37.5% | 48.9% |
| Mean | 7.5% | 8.3% |
| Median | 6.3% | 5.0% |
| Interquartile 25% (IQ1) | 4.6% | 4.4% |
| Interquartile 75% (IQ3) | 9.0% | 8.7% |
| Interquartile Range (IQR) | 4.4% | 4.2% |
| Standard Deviation (Sample) | 6.2% | 8.8% |
| Standard Deviation (Population) | 6.1% | 8.7% |
Similar Demographics by Unemployment Among Ages 55 to 59 years
Demographics Similar to Immigrants from Yemen by Unemployment Among Ages 55 to 59 years
In terms of unemployment among ages 55 to 59 years, the demographic groups most similar to Immigrants from Yemen are Puerto Rican (7.0%, a difference of 1.1%), Paiute (6.8%, a difference of 1.9%), Navajo (6.7%, a difference of 2.5%), Colville (6.7%, a difference of 2.6%), and Pueblo (6.7%, a difference of 2.8%).
| Demographics | Rating | Rank | Unemployment Among Ages 55 to 59 years |
| Immigrants | Dominican Republic | 0.0 /100 | #331 | Tragic 6.3% |
| Aleuts | 0.0 /100 | #332 | Tragic 6.4% |
| Pima | 0.0 /100 | #333 | Tragic 6.6% |
| Pueblo | 0.0 /100 | #334 | Tragic 6.7% |
| Colville | 0.0 /100 | #335 | Tragic 6.7% |
| Navajo | 0.0 /100 | #336 | Tragic 6.7% |
| Paiute | 0.0 /100 | #337 | Tragic 6.8% |
| Immigrants | Yemen | 0.0 /100 | #338 | Tragic 6.9% |
| Puerto Ricans | 0.0 /100 | #339 | Tragic 7.0% |
| Alaskan Athabascans | 0.0 /100 | #340 | Tragic 7.1% |
| Shoshone | 0.0 /100 | #341 | Tragic 7.4% |
| Hopi | 0.0 /100 | #342 | Tragic 8.1% |
| Yakama | 0.0 /100 | #343 | Tragic 8.9% |
| Inupiat | 0.0 /100 | #344 | Tragic 9.0% |
| Tohono O'odham | 0.0 /100 | #345 | Tragic 9.3% |
Demographics Similar to Immigrants from Northern Africa by Unemployment Among Ages 55 to 59 years
In terms of unemployment among ages 55 to 59 years, the demographic groups most similar to Immigrants from Northern Africa are Immigrants from Lithuania (4.8%, a difference of 0.050%), Bahamian (4.8%, a difference of 0.060%), Laotian (4.8%, a difference of 0.080%), Immigrants from Bahamas (4.8%, a difference of 0.10%), and Immigrants from Uruguay (4.8%, a difference of 0.12%).
| Demographics | Rating | Rank | Unemployment Among Ages 55 to 59 years |
| Ukrainians | 78.6 /100 | #143 | Good 4.8% |
| Immigrants | Asia | 77.8 /100 | #144 | Good 4.8% |
| Immigrants | Northern Europe | 77.5 /100 | #145 | Good 4.8% |
| Immigrants | South Eastern Asia | 77.4 /100 | #146 | Good 4.8% |
| Immigrants | Singapore | 76.6 /100 | #147 | Good 4.8% |
| Immigrants | Bahamas | 71.8 /100 | #148 | Good 4.8% |
| Immigrants | Lithuania | 70.8 /100 | #149 | Good 4.8% |
| Immigrants | Northern Africa | 69.8 /100 | #150 | Good 4.8% |
| Bahamians | 68.6 /100 | #151 | Good 4.8% |
| Laotians | 68.2 /100 | #152 | Good 4.8% |
| Immigrants | Uruguay | 67.2 /100 | #153 | Good 4.8% |
| Immigrants | Panama | 66.8 /100 | #154 | Good 4.8% |
| Immigrants | North Macedonia | 66.3 /100 | #155 | Good 4.8% |
| Italians | 66.2 /100 | #156 | Good 4.8% |
| Carpatho Rusyns | 66.0 /100 | #157 | Good 4.8% |