Immigrants from Western Europe vs Bolivian Unemployment Among Seniors over 75 years
COMPARE
Immigrants from Western Europe
Bolivian
Unemployment Among Seniors over 75 years
Unemployment Among Seniors over 75 years Comparison
Immigrants from Western Europe
Bolivians
8.9%
UNEMPLOYMENT AMONG SENIORS OVER 75 YEARS
18.2/ 100
METRIC RATING
206th/ 347
METRIC RANK
8.0%
UNEMPLOYMENT AMONG SENIORS OVER 75 YEARS
99.9/ 100
METRIC RATING
72nd/ 347
METRIC RANK
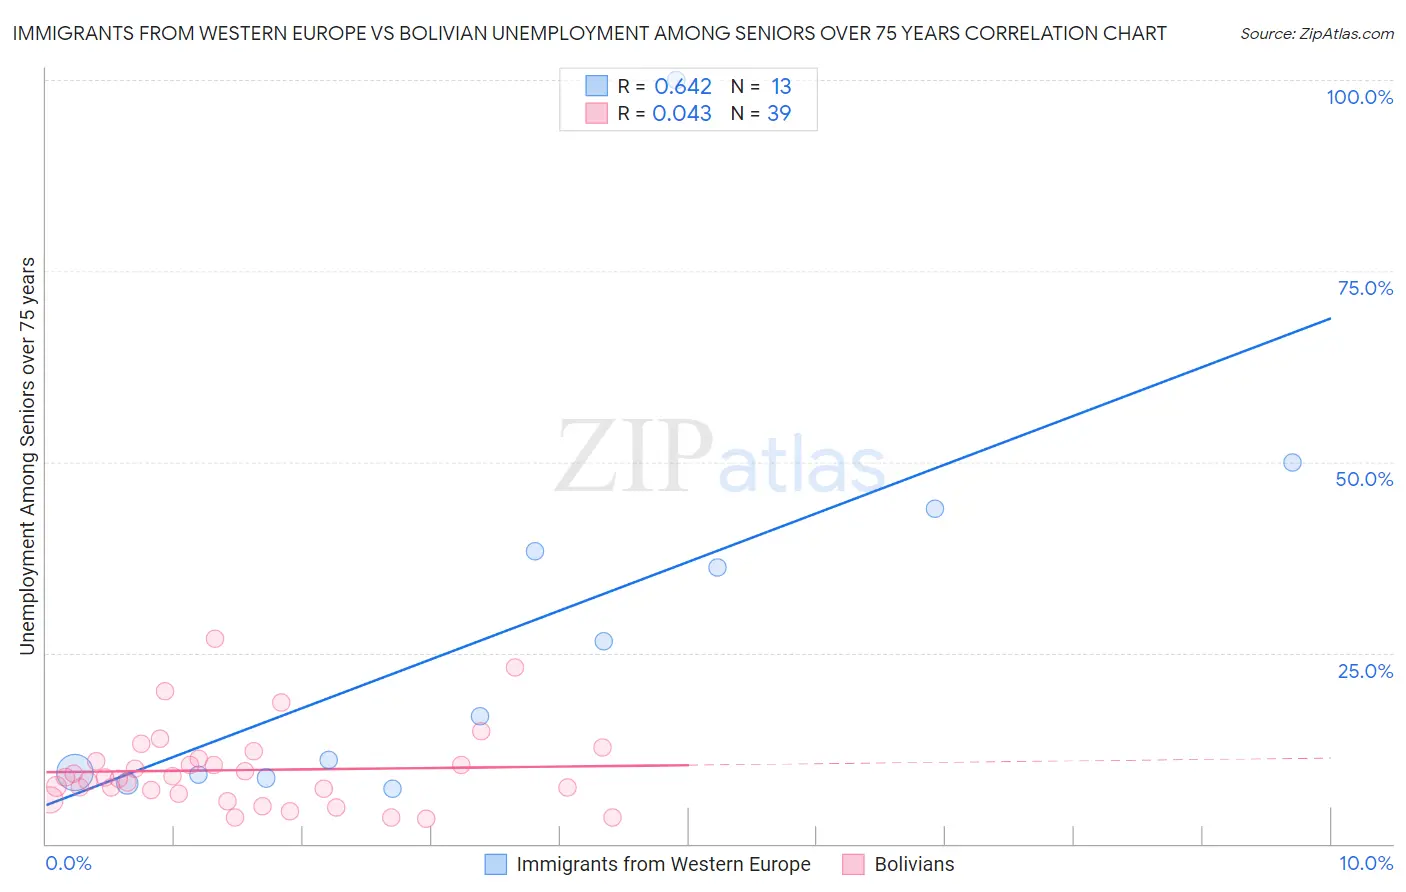
Immigrants from Western Europe vs Bolivian Unemployment Among Seniors over 75 years Correlation Chart
The statistical analysis conducted on geographies consisting of 225,070,494 people shows a significant positive correlation between the proportion of Immigrants from Western Europe and unemployment rate among seniors over the age of 75 in the United States with a correlation coefficient (R) of 0.642 and weighted average of 8.9%. Similarly, the statistical analysis conducted on geographies consisting of 122,260,083 people shows no correlation between the proportion of Bolivians and unemployment rate among seniors over the age of 75 in the United States with a correlation coefficient (R) of 0.043 and weighted average of 8.0%, a difference of 11.8%.
Unemployment Among Seniors over 75 years Correlation Summary
| Measurement | Immigrants from Western Europe | Bolivian |
| Minimum | 7.2% | 3.2% |
| Maximum | 100.0% | 26.8% |
| Range | 92.8% | 23.6% |
| Mean | 28.1% | 9.7% |
| Median | 16.7% | 8.7% |
| Interquartile 25% (IQ1) | 8.8% | 6.5% |
| Interquartile 75% (IQ3) | 41.1% | 11.2% |
| Interquartile Range (IQR) | 32.3% | 4.6% |
| Standard Deviation (Sample) | 26.5% | 5.3% |
| Standard Deviation (Population) | 25.5% | 5.2% |
Similar Demographics by Unemployment Among Seniors over 75 years
Demographics Similar to Immigrants from Western Europe by Unemployment Among Seniors over 75 years
In terms of unemployment among seniors over 75 years, the demographic groups most similar to Immigrants from Western Europe are Malaysian (8.9%, a difference of 0.18%), Immigrants from Philippines (8.9%, a difference of 0.22%), Salvadoran (8.9%, a difference of 0.27%), Korean (8.9%, a difference of 0.30%), and Spaniard (8.9%, a difference of 0.31%).
| Demographics | Rating | Rank | Unemployment Among Seniors over 75 years |
| Pakistanis | 25.4 /100 | #199 | Fair 8.9% |
| Osage | 25.4 /100 | #200 | Fair 8.9% |
| Immigrants | Peru | 24.3 /100 | #201 | Fair 8.9% |
| Russians | 24.1 /100 | #202 | Fair 8.9% |
| Immigrants | Northern Europe | 23.9 /100 | #203 | Fair 8.9% |
| Spaniards | 22.0 /100 | #204 | Fair 8.9% |
| Koreans | 21.9 /100 | #205 | Fair 8.9% |
| Immigrants | Western Europe | 18.2 /100 | #206 | Poor 8.9% |
| Malaysians | 16.3 /100 | #207 | Poor 8.9% |
| Immigrants | Philippines | 15.8 /100 | #208 | Poor 8.9% |
| Salvadorans | 15.4 /100 | #209 | Poor 8.9% |
| Bermudans | 15.0 /100 | #210 | Poor 8.9% |
| Delaware | 14.6 /100 | #211 | Poor 9.0% |
| Romanians | 13.8 /100 | #212 | Poor 9.0% |
| Immigrants | Latin America | 13.4 /100 | #213 | Poor 9.0% |
Demographics Similar to Bolivians by Unemployment Among Seniors over 75 years
In terms of unemployment among seniors over 75 years, the demographic groups most similar to Bolivians are Immigrants from Cambodia (8.0%, a difference of 0.040%), Immigrants from France (8.0%, a difference of 0.040%), Spanish American (8.0%, a difference of 0.090%), Immigrants from Argentina (8.0%, a difference of 0.11%), and Indian (Asian) (8.0%, a difference of 0.19%).
| Demographics | Rating | Rank | Unemployment Among Seniors over 75 years |
| Argentineans | 99.9 /100 | #65 | Exceptional 7.9% |
| Immigrants | Austria | 99.9 /100 | #66 | Exceptional 8.0% |
| Immigrants | Syria | 99.9 /100 | #67 | Exceptional 8.0% |
| Immigrants | South Africa | 99.9 /100 | #68 | Exceptional 8.0% |
| Indians (Asian) | 99.9 /100 | #69 | Exceptional 8.0% |
| Immigrants | Argentina | 99.9 /100 | #70 | Exceptional 8.0% |
| Immigrants | Cambodia | 99.9 /100 | #71 | Exceptional 8.0% |
| Bolivians | 99.9 /100 | #72 | Exceptional 8.0% |
| Immigrants | France | 99.9 /100 | #73 | Exceptional 8.0% |
| Spanish Americans | 99.8 /100 | #74 | Exceptional 8.0% |
| Immigrants | Uganda | 99.8 /100 | #75 | Exceptional 8.0% |
| Immigrants | Venezuela | 99.8 /100 | #76 | Exceptional 8.0% |
| Immigrants | Turkey | 99.8 /100 | #77 | Exceptional 8.0% |
| Immigrants | Belarus | 99.8 /100 | #78 | Exceptional 8.0% |
| Immigrants | Japan | 99.7 /100 | #79 | Exceptional 8.0% |