Immigrants from West Indies vs Immigrants from Norway Unemployment Among Seniors over 65 years
COMPARE
Immigrants from West Indies
Immigrants from Norway
Unemployment Among Seniors over 65 years
Unemployment Among Seniors over 65 years Comparison
Immigrants from West Indies
Immigrants from Norway
5.6%
UNEMPLOYMENT AMONG SENIORS OVER 65 YEARS
0.0/ 100
METRIC RATING
298th/ 347
METRIC RANK
5.5%
UNEMPLOYMENT AMONG SENIORS OVER 65 YEARS
0.0/ 100
METRIC RATING
281st/ 347
METRIC RANK
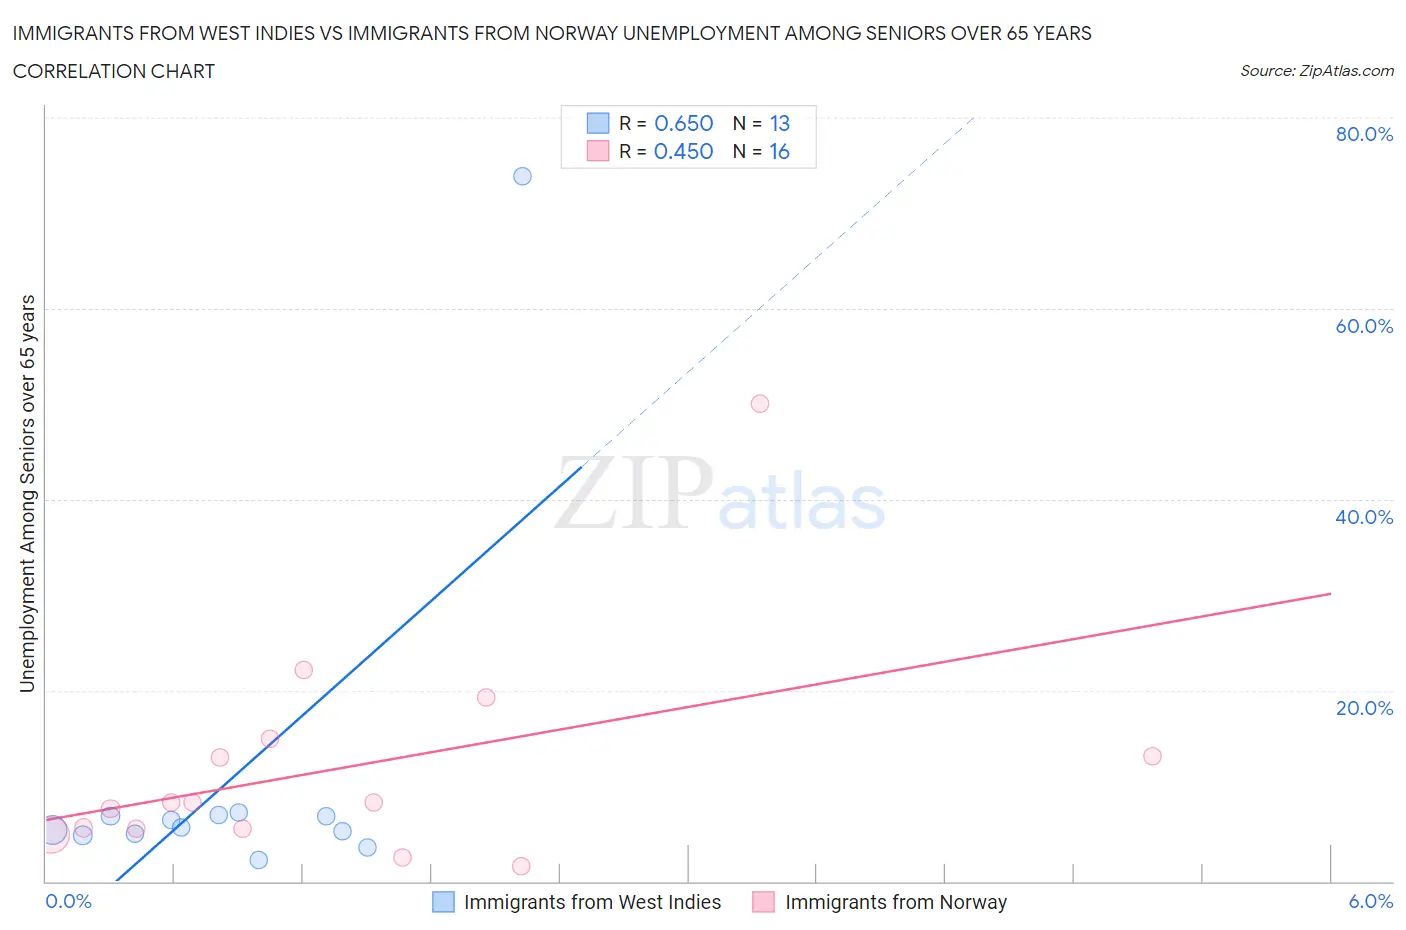
Immigrants from West Indies vs Immigrants from Norway Unemployment Among Seniors over 65 years Correlation Chart
The statistical analysis conducted on geographies consisting of 71,058,971 people shows a significant positive correlation between the proportion of Immigrants from West Indies and unemployment rate amomg seniors over the age of 65 in the United States with a correlation coefficient (R) of 0.650 and weighted average of 5.6%. Similarly, the statistical analysis conducted on geographies consisting of 112,213,806 people shows a moderate positive correlation between the proportion of Immigrants from Norway and unemployment rate amomg seniors over the age of 65 in the United States with a correlation coefficient (R) of 0.450 and weighted average of 5.5%, a difference of 1.7%.
Unemployment Among Seniors over 65 years Correlation Summary
| Measurement | Immigrants from West Indies | Immigrants from Norway |
| Minimum | 2.2% | 1.6% |
| Maximum | 73.8% | 50.0% |
| Range | 71.6% | 48.4% |
| Mean | 10.7% | 11.9% |
| Median | 5.6% | 8.2% |
| Interquartile 25% (IQ1) | 4.9% | 5.5% |
| Interquartile 75% (IQ3) | 6.9% | 14.0% |
| Interquartile Range (IQR) | 2.0% | 8.5% |
| Standard Deviation (Sample) | 19.0% | 11.7% |
| Standard Deviation (Population) | 18.3% | 11.3% |
Demographics Similar to Immigrants from West Indies and Immigrants from Norway by Unemployment Among Seniors over 65 years
In terms of unemployment among seniors over 65 years, the demographic groups most similar to Immigrants from West Indies are Guyanese (5.6%, a difference of 0.090%), Yaqui (5.5%, a difference of 0.12%), Cape Verdean (5.5%, a difference of 0.13%), Cheyenne (5.5%, a difference of 0.14%), and Armenian (5.5%, a difference of 0.21%). Similarly, the demographic groups most similar to Immigrants from Norway are Immigrants from Belize (5.5%, a difference of 0.13%), Immigrants from South America (5.5%, a difference of 0.15%), Brazilian (5.5%, a difference of 0.19%), Immigrants from Haiti (5.5%, a difference of 0.32%), and Immigrants from Liberia (5.5%, a difference of 0.63%).
| Demographics | Rating | Rank | Unemployment Among Seniors over 65 years |
| Brazilians | 0.1 /100 | #279 | Tragic 5.5% |
| Immigrants | South America | 0.1 /100 | #280 | Tragic 5.5% |
| Immigrants | Norway | 0.0 /100 | #281 | Tragic 5.5% |
| Immigrants | Belize | 0.0 /100 | #282 | Tragic 5.5% |
| Immigrants | Haiti | 0.0 /100 | #283 | Tragic 5.5% |
| Immigrants | Liberia | 0.0 /100 | #284 | Tragic 5.5% |
| Central Americans | 0.0 /100 | #285 | Tragic 5.5% |
| Immigrants | Barbados | 0.0 /100 | #286 | Tragic 5.5% |
| Venezuelans | 0.0 /100 | #287 | Tragic 5.5% |
| U.S. Virgin Islanders | 0.0 /100 | #288 | Tragic 5.5% |
| Immigrants | Cabo Verde | 0.0 /100 | #289 | Tragic 5.5% |
| Jamaicans | 0.0 /100 | #290 | Tragic 5.5% |
| Blacks/African Americans | 0.0 /100 | #291 | Tragic 5.5% |
| Belizeans | 0.0 /100 | #292 | Tragic 5.5% |
| Immigrants | Venezuela | 0.0 /100 | #293 | Tragic 5.5% |
| Armenians | 0.0 /100 | #294 | Tragic 5.5% |
| Cheyenne | 0.0 /100 | #295 | Tragic 5.5% |
| Cape Verdeans | 0.0 /100 | #296 | Tragic 5.5% |
| Yaqui | 0.0 /100 | #297 | Tragic 5.5% |
| Immigrants | West Indies | 0.0 /100 | #298 | Tragic 5.6% |
| Guyanese | 0.0 /100 | #299 | Tragic 5.6% |