Immigrants from West Indies vs Immigrants from the Azores Unemployment Among Women with Children Under 18 years
COMPARE
Immigrants from West Indies
Immigrants from the Azores
Unemployment Among Women with Children Under 18 years
Unemployment Among Women with Children Under 18 years Comparison
Immigrants from West Indies
Immigrants from the Azores
6.6%
UNEMPLOYMENT AMONG WOMEN WITH CHILDREN UNDER 18 YEARS
0.0/ 100
METRIC RATING
315th/ 347
METRIC RANK
6.0%
UNEMPLOYMENT AMONG WOMEN WITH CHILDREN UNDER 18 YEARS
0.3/ 100
METRIC RATING
254th/ 347
METRIC RANK
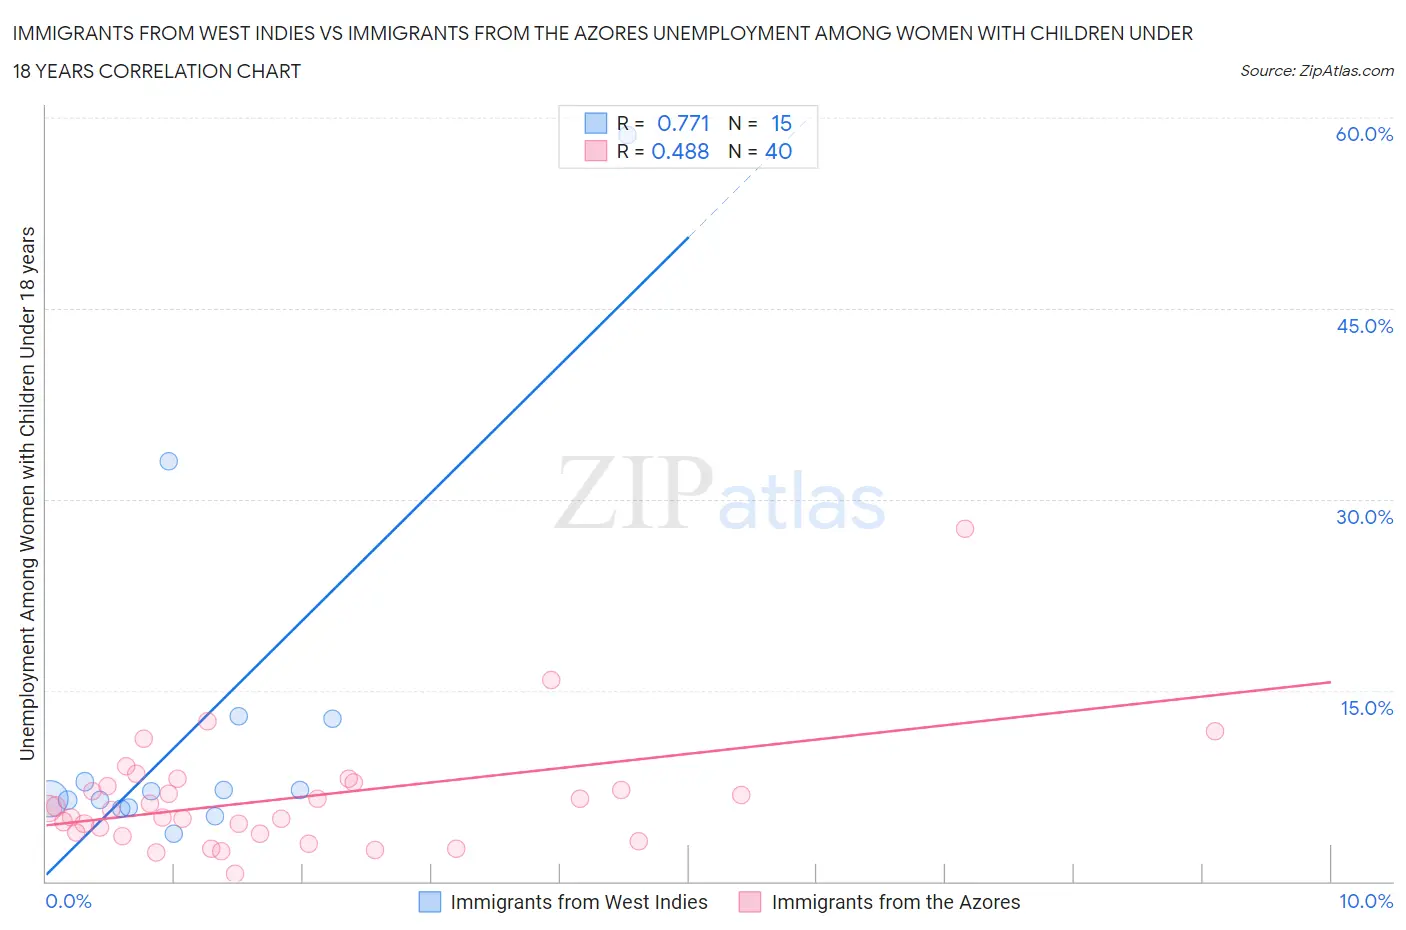
Immigrants from West Indies vs Immigrants from the Azores Unemployment Among Women with Children Under 18 years Correlation Chart
The statistical analysis conducted on geographies consisting of 72,129,046 people shows a strong positive correlation between the proportion of Immigrants from West Indies and unemployment rate among women with children under the age of 18 in the United States with a correlation coefficient (R) of 0.771 and weighted average of 6.6%. Similarly, the statistical analysis conducted on geographies consisting of 45,622,846 people shows a moderate positive correlation between the proportion of Immigrants from the Azores and unemployment rate among women with children under the age of 18 in the United States with a correlation coefficient (R) of 0.488 and weighted average of 6.0%, a difference of 9.9%.
Unemployment Among Women with Children Under 18 years Correlation Summary
| Measurement | Immigrants from West Indies | Immigrants from the Azores |
| Minimum | 3.7% | 0.60% |
| Maximum | 58.6% | 27.7% |
| Range | 54.9% | 27.1% |
| Mean | 12.4% | 6.5% |
| Median | 7.1% | 5.6% |
| Interquartile 25% (IQ1) | 5.8% | 3.8% |
| Interquartile 75% (IQ3) | 12.8% | 7.7% |
| Interquartile Range (IQR) | 7.0% | 3.9% |
| Standard Deviation (Sample) | 14.6% | 4.6% |
| Standard Deviation (Population) | 14.1% | 4.6% |
Similar Demographics by Unemployment Among Women with Children Under 18 years
Demographics Similar to Immigrants from West Indies by Unemployment Among Women with Children Under 18 years
In terms of unemployment among women with children under 18 years, the demographic groups most similar to Immigrants from West Indies are British West Indian (6.6%, a difference of 0.0%), Hispanic or Latino (6.6%, a difference of 0.14%), Immigrants from Ecuador (6.6%, a difference of 0.34%), Shoshone (6.6%, a difference of 0.38%), and Immigrants from Mexico (6.6%, a difference of 0.43%).
| Demographics | Rating | Rank | Unemployment Among Women with Children Under 18 years |
| Africans | 0.0 /100 | #308 | Tragic 6.5% |
| Ecuadorians | 0.0 /100 | #309 | Tragic 6.5% |
| Guyanese | 0.0 /100 | #310 | Tragic 6.6% |
| Yaqui | 0.0 /100 | #311 | Tragic 6.6% |
| Immigrants | Mexico | 0.0 /100 | #312 | Tragic 6.6% |
| Hispanics or Latinos | 0.0 /100 | #313 | Tragic 6.6% |
| British West Indians | 0.0 /100 | #314 | Tragic 6.6% |
| Immigrants | West Indies | 0.0 /100 | #315 | Tragic 6.6% |
| Immigrants | Ecuador | 0.0 /100 | #316 | Tragic 6.6% |
| Shoshone | 0.0 /100 | #317 | Tragic 6.6% |
| Alaska Natives | 0.0 /100 | #318 | Tragic 6.7% |
| Central American Indians | 0.0 /100 | #319 | Tragic 6.7% |
| Immigrants | Belize | 0.0 /100 | #320 | Tragic 6.7% |
| U.S. Virgin Islanders | 0.0 /100 | #321 | Tragic 6.7% |
| Houma | 0.0 /100 | #322 | Tragic 6.8% |
Demographics Similar to Immigrants from the Azores by Unemployment Among Women with Children Under 18 years
In terms of unemployment among women with children under 18 years, the demographic groups most similar to Immigrants from the Azores are Liberian (6.0%, a difference of 0.39%), Nepalese (6.0%, a difference of 0.47%), Immigrants from Congo (6.0%, a difference of 0.75%), Seminole (6.0%, a difference of 0.97%), and Bermudan (6.1%, a difference of 1.0%).
| Demographics | Rating | Rank | Unemployment Among Women with Children Under 18 years |
| Cape Verdeans | 1.0 /100 | #247 | Tragic 5.9% |
| Delaware | 0.8 /100 | #248 | Tragic 5.9% |
| Immigrants | Cameroon | 0.8 /100 | #249 | Tragic 5.9% |
| Immigrants | Cabo Verde | 0.7 /100 | #250 | Tragic 5.9% |
| Ute | 0.7 /100 | #251 | Tragic 5.9% |
| Seminole | 0.5 /100 | #252 | Tragic 6.0% |
| Immigrants | Congo | 0.4 /100 | #253 | Tragic 6.0% |
| Immigrants | Azores | 0.3 /100 | #254 | Tragic 6.0% |
| Liberians | 0.2 /100 | #255 | Tragic 6.0% |
| Nepalese | 0.2 /100 | #256 | Tragic 6.0% |
| Bermudans | 0.1 /100 | #257 | Tragic 6.1% |
| Immigrants | Nigeria | 0.1 /100 | #258 | Tragic 6.1% |
| Ottawa | 0.1 /100 | #259 | Tragic 6.1% |
| Nigerians | 0.1 /100 | #260 | Tragic 6.1% |
| Immigrants | Liberia | 0.1 /100 | #261 | Tragic 6.1% |