Immigrants from Vietnam vs Menominee Female Unemployment
COMPARE
Immigrants from Vietnam
Menominee
Female Unemployment
Female Unemployment Comparison
Immigrants from Vietnam
Menominee
5.3%
FEMALE UNEMPLOYMENT
47.5/ 100
METRIC RATING
176th/ 347
METRIC RANK
7.0%
FEMALE UNEMPLOYMENT
0.0/ 100
METRIC RATING
333rd/ 347
METRIC RANK
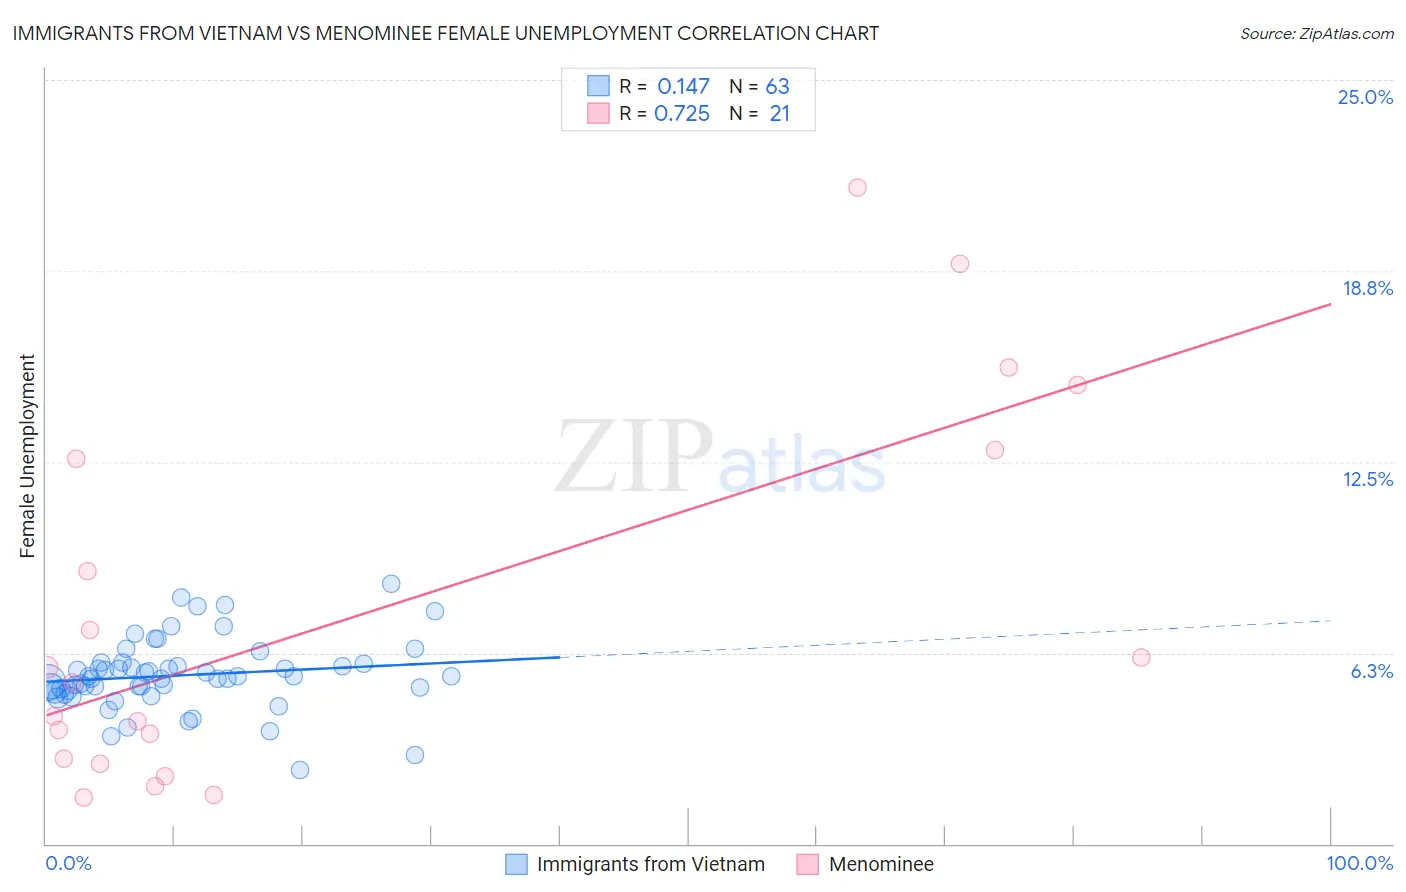
Immigrants from Vietnam vs Menominee Female Unemployment Correlation Chart
The statistical analysis conducted on geographies consisting of 403,388,907 people shows a poor positive correlation between the proportion of Immigrants from Vietnam and unemploymnet rate among females in the United States with a correlation coefficient (R) of 0.147 and weighted average of 5.3%. Similarly, the statistical analysis conducted on geographies consisting of 45,628,171 people shows a strong positive correlation between the proportion of Menominee and unemploymnet rate among females in the United States with a correlation coefficient (R) of 0.725 and weighted average of 7.0%, a difference of 33.8%.
Female Unemployment Correlation Summary
| Measurement | Immigrants from Vietnam | Menominee |
| Minimum | 2.4% | 1.5% |
| Maximum | 8.5% | 21.5% |
| Range | 6.1% | 20.0% |
| Mean | 5.5% | 7.5% |
| Median | 5.5% | 5.3% |
| Interquartile 25% (IQ1) | 5.0% | 2.7% |
| Interquartile 75% (IQ3) | 5.9% | 12.7% |
| Interquartile Range (IQR) | 0.88% | 10.0% |
| Standard Deviation (Sample) | 1.1% | 6.1% |
| Standard Deviation (Population) | 1.1% | 6.0% |
Similar Demographics by Female Unemployment
Demographics Similar to Immigrants from Vietnam by Female Unemployment
In terms of female unemployment, the demographic groups most similar to Immigrants from Vietnam are Immigrants from Laos (5.3%, a difference of 0.0%), Immigrants from Morocco (5.3%, a difference of 0.0%), Immigrants from Southern Europe (5.3%, a difference of 0.080%), Laotian (5.3%, a difference of 0.14%), and Immigrants from Poland (5.3%, a difference of 0.15%).
| Demographics | Rating | Rank | Female Unemployment |
| Immigrants | Chile | 59.0 /100 | #169 | Average 5.2% |
| Spanish | 55.9 /100 | #170 | Average 5.2% |
| Immigrants | Denmark | 55.0 /100 | #171 | Average 5.2% |
| Immigrants | Uganda | 50.7 /100 | #172 | Average 5.3% |
| Iranians | 50.4 /100 | #173 | Average 5.3% |
| Immigrants | Poland | 50.0 /100 | #174 | Average 5.3% |
| Immigrants | Laos | 47.5 /100 | #175 | Average 5.3% |
| Immigrants | Vietnam | 47.5 /100 | #176 | Average 5.3% |
| Immigrants | Morocco | 47.4 /100 | #177 | Average 5.3% |
| Immigrants | Southern Europe | 46.2 /100 | #178 | Average 5.3% |
| Laotians | 45.1 /100 | #179 | Average 5.3% |
| Immigrants | Congo | 43.1 /100 | #180 | Average 5.3% |
| Taiwanese | 42.7 /100 | #181 | Average 5.3% |
| Immigrants | Nonimmigrants | 42.6 /100 | #182 | Average 5.3% |
| Immigrants | Indonesia | 40.7 /100 | #183 | Average 5.3% |
Demographics Similar to Menominee by Female Unemployment
In terms of female unemployment, the demographic groups most similar to Menominee are Sioux (7.0%, a difference of 0.020%), Immigrants from Armenia (7.1%, a difference of 0.41%), Dominican (7.2%, a difference of 1.8%), Immigrants from Dominican Republic (7.2%, a difference of 2.5%), and Navajo (7.3%, a difference of 3.5%).
| Demographics | Rating | Rank | Female Unemployment |
| Natives/Alaskans | 0.0 /100 | #326 | Tragic 6.6% |
| Alaska Natives | 0.0 /100 | #327 | Tragic 6.6% |
| Guyanese | 0.0 /100 | #328 | Tragic 6.7% |
| Immigrants | Guyana | 0.0 /100 | #329 | Tragic 6.7% |
| Yakama | 0.0 /100 | #330 | Tragic 6.7% |
| Paiute | 0.0 /100 | #331 | Tragic 6.8% |
| Sioux | 0.0 /100 | #332 | Tragic 7.0% |
| Menominee | 0.0 /100 | #333 | Tragic 7.0% |
| Immigrants | Armenia | 0.0 /100 | #334 | Tragic 7.1% |
| Dominicans | 0.0 /100 | #335 | Tragic 7.2% |
| Immigrants | Dominican Republic | 0.0 /100 | #336 | Tragic 7.2% |
| Navajo | 0.0 /100 | #337 | Tragic 7.3% |
| Tohono O'odham | 0.0 /100 | #338 | Tragic 7.7% |
| Immigrants | Yemen | 0.0 /100 | #339 | Tragic 7.8% |
| Hopi | 0.0 /100 | #340 | Tragic 8.1% |