Immigrants from Vietnam vs Honduran Unemployment Among Ages 25 to 29 years
COMPARE
Immigrants from Vietnam
Honduran
Unemployment Among Ages 25 to 29 years
Unemployment Among Ages 25 to 29 years Comparison
Immigrants from Vietnam
Hondurans
6.5%
UNEMPLOYMENT AMONG AGES 25 TO 29 YEARS
75.6/ 100
METRIC RATING
134th/ 347
METRIC RANK
7.1%
UNEMPLOYMENT AMONG AGES 25 TO 29 YEARS
1.8/ 100
METRIC RATING
238th/ 347
METRIC RANK
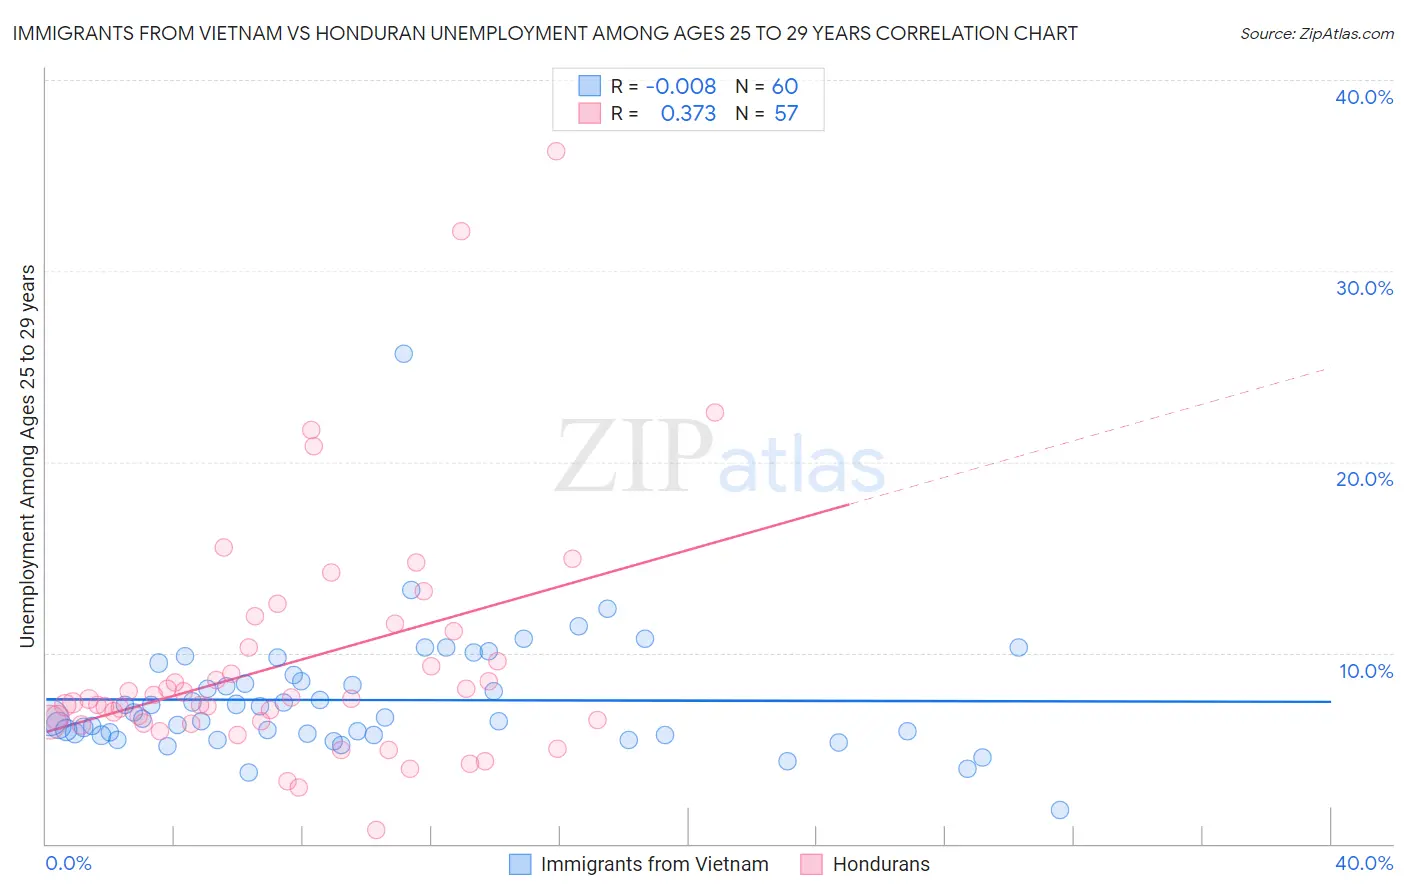
Immigrants from Vietnam vs Honduran Unemployment Among Ages 25 to 29 years Correlation Chart
The statistical analysis conducted on geographies consisting of 387,105,673 people shows no correlation between the proportion of Immigrants from Vietnam and unemployment rate among population between the ages 25 and 29 in the United States with a correlation coefficient (R) of -0.008 and weighted average of 6.5%. Similarly, the statistical analysis conducted on geographies consisting of 345,754,458 people shows a mild positive correlation between the proportion of Hondurans and unemployment rate among population between the ages 25 and 29 in the United States with a correlation coefficient (R) of 0.373 and weighted average of 7.1%, a difference of 8.0%.
Unemployment Among Ages 25 to 29 years Correlation Summary
| Measurement | Immigrants from Vietnam | Honduran |
| Minimum | 1.8% | 0.70% |
| Maximum | 25.7% | 36.3% |
| Range | 23.9% | 35.6% |
| Mean | 7.5% | 9.5% |
| Median | 6.6% | 7.6% |
| Interquartile 25% (IQ1) | 5.7% | 6.4% |
| Interquartile 75% (IQ3) | 8.7% | 10.7% |
| Interquartile Range (IQR) | 2.9% | 4.3% |
| Standard Deviation (Sample) | 3.3% | 6.4% |
| Standard Deviation (Population) | 3.2% | 6.4% |
Similar Demographics by Unemployment Among Ages 25 to 29 years
Demographics Similar to Immigrants from Vietnam by Unemployment Among Ages 25 to 29 years
In terms of unemployment among ages 25 to 29 years, the demographic groups most similar to Immigrants from Vietnam are Immigrants from Europe (6.5%, a difference of 0.010%), Immigrants from Croatia (6.5%, a difference of 0.010%), Northern European (6.5%, a difference of 0.020%), Polish (6.5%, a difference of 0.090%), and Eastern European (6.5%, a difference of 0.13%).
| Demographics | Rating | Rank | Unemployment Among Ages 25 to 29 years |
| Dutch | 80.6 /100 | #127 | Excellent 6.5% |
| Immigrants | Chile | 80.5 /100 | #128 | Excellent 6.5% |
| Sri Lankans | 80.3 /100 | #129 | Excellent 6.5% |
| Immigrants | Peru | 79.9 /100 | #130 | Good 6.5% |
| Immigrants | Afghanistan | 79.2 /100 | #131 | Good 6.5% |
| Poles | 76.6 /100 | #132 | Good 6.5% |
| Immigrants | Europe | 75.7 /100 | #133 | Good 6.5% |
| Immigrants | Vietnam | 75.6 /100 | #134 | Good 6.5% |
| Immigrants | Croatia | 75.5 /100 | #135 | Good 6.5% |
| Northern Europeans | 75.4 /100 | #136 | Good 6.5% |
| Eastern Europeans | 74.1 /100 | #137 | Good 6.5% |
| Immigrants | Belgium | 73.8 /100 | #138 | Good 6.5% |
| Austrians | 73.8 /100 | #139 | Good 6.5% |
| Immigrants | Pakistan | 73.8 /100 | #140 | Good 6.5% |
| Maltese | 72.9 /100 | #141 | Good 6.5% |
Demographics Similar to Hondurans by Unemployment Among Ages 25 to 29 years
In terms of unemployment among ages 25 to 29 years, the demographic groups most similar to Hondurans are Puget Sound Salish (7.1%, a difference of 0.020%), Cape Verdean (7.0%, a difference of 0.090%), Panamanian (7.0%, a difference of 0.23%), French Canadian (7.0%, a difference of 0.39%), and Immigrants from Honduras (7.0%, a difference of 0.41%).
| Demographics | Rating | Rank | Unemployment Among Ages 25 to 29 years |
| Central Americans | 3.0 /100 | #231 | Tragic 7.0% |
| Spanish Americans | 2.7 /100 | #232 | Tragic 7.0% |
| Immigrants | Honduras | 2.4 /100 | #233 | Tragic 7.0% |
| French Canadians | 2.4 /100 | #234 | Tragic 7.0% |
| Panamanians | 2.1 /100 | #235 | Tragic 7.0% |
| Cape Verdeans | 1.9 /100 | #236 | Tragic 7.0% |
| Puget Sound Salish | 1.8 /100 | #237 | Tragic 7.1% |
| Hondurans | 1.8 /100 | #238 | Tragic 7.1% |
| Potawatomi | 1.3 /100 | #239 | Tragic 7.1% |
| Native Hawaiians | 1.3 /100 | #240 | Tragic 7.1% |
| Immigrants | Sierra Leone | 1.3 /100 | #241 | Tragic 7.1% |
| Spanish American Indians | 1.1 /100 | #242 | Tragic 7.1% |
| Yaqui | 1.0 /100 | #243 | Tragic 7.1% |
| Immigrants | Nonimmigrants | 0.9 /100 | #244 | Tragic 7.1% |
| Guatemalans | 0.9 /100 | #245 | Tragic 7.1% |