Immigrants from Vietnam vs Asian Unemployment Among Ages 60 to 64 years
COMPARE
Immigrants from Vietnam
Asian
Unemployment Among Ages 60 to 64 years
Unemployment Among Ages 60 to 64 years Comparison
Immigrants from Vietnam
Asians
4.9%
UNEMPLOYMENT AMONG AGES 60 TO 64 YEARS
23.7/ 100
METRIC RATING
199th/ 347
METRIC RANK
4.9%
UNEMPLOYMENT AMONG AGES 60 TO 64 YEARS
40.8/ 100
METRIC RATING
180th/ 347
METRIC RANK
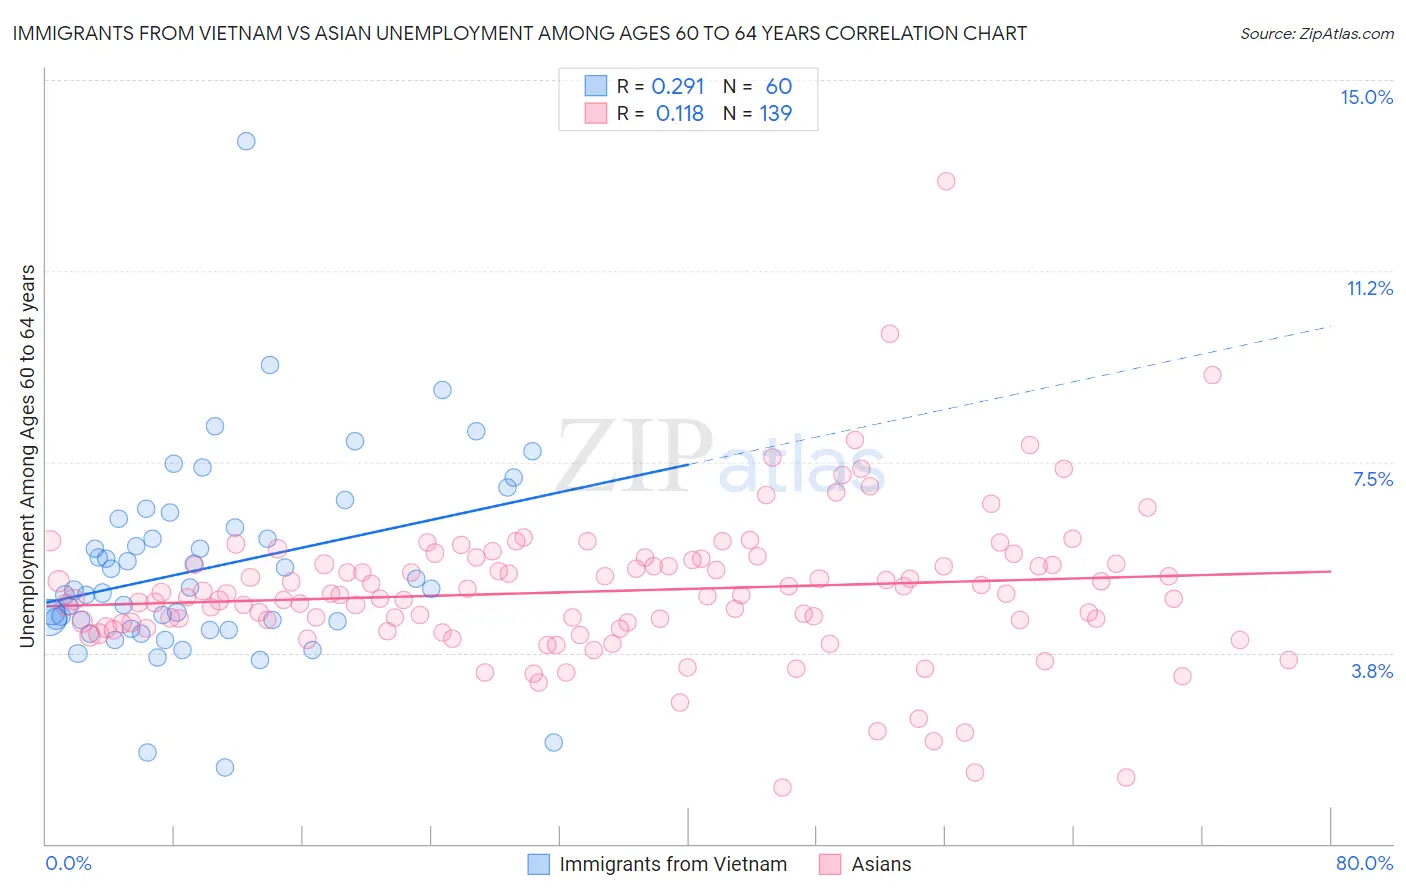
Immigrants from Vietnam vs Asian Unemployment Among Ages 60 to 64 years Correlation Chart
The statistical analysis conducted on geographies consisting of 368,188,047 people shows a weak positive correlation between the proportion of Immigrants from Vietnam and unemployment rate among population between the ages 60 and 64 in the United States with a correlation coefficient (R) of 0.291 and weighted average of 4.9%. Similarly, the statistical analysis conducted on geographies consisting of 460,909,044 people shows a poor positive correlation between the proportion of Asians and unemployment rate among population between the ages 60 and 64 in the United States with a correlation coefficient (R) of 0.118 and weighted average of 4.9%, a difference of 0.70%.
Unemployment Among Ages 60 to 64 years Correlation Summary
| Measurement | Immigrants from Vietnam | Asian |
| Minimum | 1.5% | 1.1% |
| Maximum | 13.8% | 13.0% |
| Range | 12.3% | 11.9% |
| Mean | 5.4% | 5.0% |
| Median | 5.0% | 4.9% |
| Interquartile 25% (IQ1) | 4.3% | 4.2% |
| Interquartile 75% (IQ3) | 6.3% | 5.5% |
| Interquartile Range (IQR) | 2.0% | 1.3% |
| Standard Deviation (Sample) | 1.9% | 1.5% |
| Standard Deviation (Population) | 1.9% | 1.5% |
Demographics Similar to Immigrants from Vietnam and Asians by Unemployment Among Ages 60 to 64 years
In terms of unemployment among ages 60 to 64 years, the demographic groups most similar to Immigrants from Vietnam are Guamanian/Chamorro (4.9%, a difference of 0.0%), Immigrants from Eastern Europe (4.9%, a difference of 0.070%), Immigrants from Asia (4.9%, a difference of 0.10%), Immigrants from Colombia (4.9%, a difference of 0.14%), and Immigrants from Austria (4.9%, a difference of 0.14%). Similarly, the demographic groups most similar to Asians are Hungarian (4.9%, a difference of 0.0%), Sri Lankan (4.9%, a difference of 0.040%), Subsaharan African (4.9%, a difference of 0.070%), Immigrants from Ukraine (4.9%, a difference of 0.12%), and Ute (4.9%, a difference of 0.12%).
| Demographics | Rating | Rank | Unemployment Among Ages 60 to 64 years |
| Immigrants | Sweden | 44.3 /100 | #179 | Average 4.9% |
| Asians | 40.8 /100 | #180 | Average 4.9% |
| Hungarians | 40.6 /100 | #181 | Average 4.9% |
| Sri Lankans | 39.8 /100 | #182 | Fair 4.9% |
| Sub-Saharan Africans | 38.9 /100 | #183 | Fair 4.9% |
| Immigrants | Ukraine | 37.6 /100 | #184 | Fair 4.9% |
| Ute | 37.4 /100 | #185 | Fair 4.9% |
| Spaniards | 35.8 /100 | #186 | Fair 4.9% |
| South American Indians | 31.2 /100 | #187 | Fair 4.9% |
| Nicaraguans | 30.4 /100 | #188 | Fair 4.9% |
| Immigrants | Nicaragua | 29.8 /100 | #189 | Fair 4.9% |
| Immigrants | Europe | 29.8 /100 | #190 | Fair 4.9% |
| Immigrants | Nigeria | 29.6 /100 | #191 | Fair 4.9% |
| Menominee | 28.8 /100 | #192 | Fair 4.9% |
| Houma | 28.3 /100 | #193 | Fair 4.9% |
| Immigrants | Colombia | 26.8 /100 | #194 | Fair 4.9% |
| Immigrants | Austria | 26.6 /100 | #195 | Fair 4.9% |
| Immigrants | Asia | 25.7 /100 | #196 | Fair 4.9% |
| Immigrants | Eastern Europe | 25.2 /100 | #197 | Fair 4.9% |
| Guamanians/Chamorros | 23.7 /100 | #198 | Fair 4.9% |
| Immigrants | Vietnam | 23.7 /100 | #199 | Fair 4.9% |