Immigrants from Venezuela vs South American Unemployment Among Ages 30 to 34 years
COMPARE
Immigrants from Venezuela
South American
Unemployment Among Ages 30 to 34 years
Unemployment Among Ages 30 to 34 years Comparison
Immigrants from Venezuela
South Americans
4.6%
UNEMPLOYMENT AMONG AGES 30 TO 34 YEARS
100.0/ 100
METRIC RATING
3rd/ 347
METRIC RANK
5.4%
UNEMPLOYMENT AMONG AGES 30 TO 34 YEARS
52.9/ 100
METRIC RATING
168th/ 347
METRIC RANK
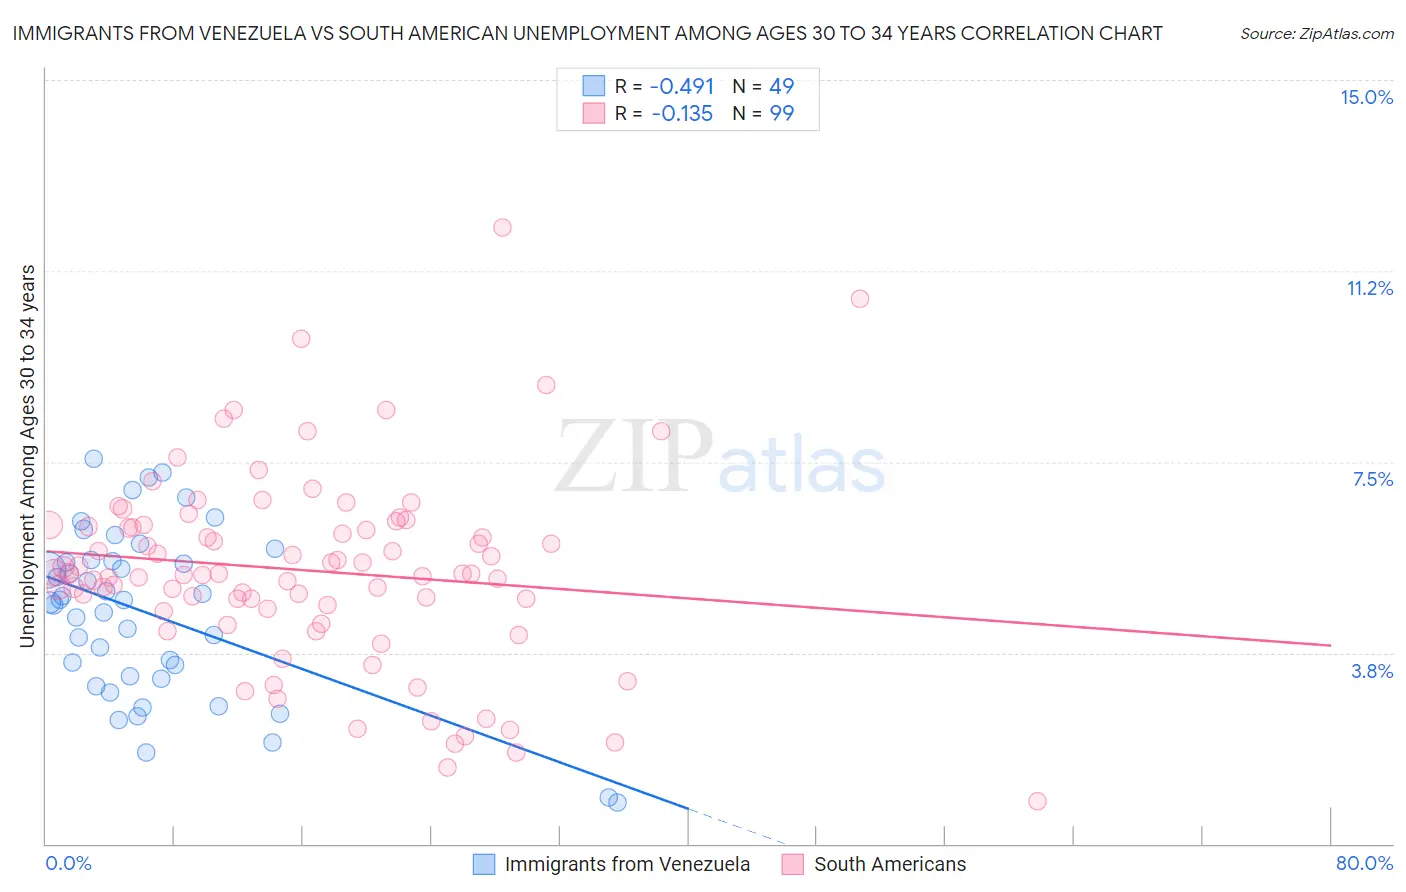
Immigrants from Venezuela vs South American Unemployment Among Ages 30 to 34 years Correlation Chart
The statistical analysis conducted on geographies consisting of 277,644,138 people shows a moderate negative correlation between the proportion of Immigrants from Venezuela and unemployment rate among population between the ages 30 and 34 in the United States with a correlation coefficient (R) of -0.491 and weighted average of 4.6%. Similarly, the statistical analysis conducted on geographies consisting of 454,693,762 people shows a poor negative correlation between the proportion of South Americans and unemployment rate among population between the ages 30 and 34 in the United States with a correlation coefficient (R) of -0.135 and weighted average of 5.4%, a difference of 17.5%.
Unemployment Among Ages 30 to 34 years Correlation Summary
| Measurement | Immigrants from Venezuela | South American |
| Minimum | 0.80% | 0.85% |
| Maximum | 7.6% | 12.1% |
| Range | 6.8% | 11.3% |
| Mean | 4.5% | 5.4% |
| Median | 4.8% | 5.3% |
| Interquartile 25% (IQ1) | 3.3% | 4.6% |
| Interquartile 75% (IQ3) | 5.6% | 6.3% |
| Interquartile Range (IQR) | 2.3% | 1.6% |
| Standard Deviation (Sample) | 1.6% | 1.9% |
| Standard Deviation (Population) | 1.6% | 1.9% |
Similar Demographics by Unemployment Among Ages 30 to 34 years
Demographics Similar to Immigrants from Venezuela by Unemployment Among Ages 30 to 34 years
In terms of unemployment among ages 30 to 34 years, the demographic groups most similar to Immigrants from Venezuela are Immigrants from Nepal (4.7%, a difference of 0.67%), Venezuelan (4.7%, a difference of 1.3%), Immigrants from Bosnia and Herzegovina (4.7%, a difference of 1.5%), Sudanese (4.6%, a difference of 1.6%), and Thai (4.7%, a difference of 1.8%).
| Demographics | Rating | Rank | Unemployment Among Ages 30 to 34 years |
| Immigrants | India | 100.0 /100 | #1 | Exceptional 4.5% |
| Sudanese | 100.0 /100 | #2 | Exceptional 4.6% |
| Immigrants | Venezuela | 100.0 /100 | #3 | Exceptional 4.6% |
| Immigrants | Nepal | 100.0 /100 | #4 | Exceptional 4.7% |
| Venezuelans | 100.0 /100 | #5 | Exceptional 4.7% |
| Immigrants | Bosnia and Herzegovina | 100.0 /100 | #6 | Exceptional 4.7% |
| Thais | 100.0 /100 | #7 | Exceptional 4.7% |
| Immigrants | Eritrea | 100.0 /100 | #8 | Exceptional 4.7% |
| Bulgarians | 99.9 /100 | #9 | Exceptional 4.7% |
| Tongans | 99.9 /100 | #10 | Exceptional 4.8% |
| Immigrants | Bolivia | 99.9 /100 | #11 | Exceptional 4.8% |
| Filipinos | 99.9 /100 | #12 | Exceptional 4.8% |
| Cambodians | 99.9 /100 | #13 | Exceptional 4.8% |
| Luxembourgers | 99.9 /100 | #14 | Exceptional 4.8% |
| Okinawans | 99.9 /100 | #15 | Exceptional 4.8% |
Demographics Similar to South Americans by Unemployment Among Ages 30 to 34 years
In terms of unemployment among ages 30 to 34 years, the demographic groups most similar to South Americans are Immigrants from Israel (5.4%, a difference of 0.010%), Dutch (5.5%, a difference of 0.020%), Scottish (5.5%, a difference of 0.080%), Immigrants from Austria (5.5%, a difference of 0.12%), and English (5.4%, a difference of 0.13%).
| Demographics | Rating | Rank | Unemployment Among Ages 30 to 34 years |
| Austrians | 59.0 /100 | #161 | Average 5.4% |
| Brazilians | 58.2 /100 | #162 | Average 5.4% |
| Arabs | 57.7 /100 | #163 | Average 5.4% |
| Basques | 57.3 /100 | #164 | Average 5.4% |
| Welsh | 56.3 /100 | #165 | Average 5.4% |
| Immigrants | Thailand | 55.6 /100 | #166 | Average 5.4% |
| English | 54.8 /100 | #167 | Average 5.4% |
| South Americans | 52.9 /100 | #168 | Average 5.4% |
| Immigrants | Israel | 52.9 /100 | #169 | Average 5.4% |
| Dutch | 52.6 /100 | #170 | Average 5.5% |
| Scottish | 51.8 /100 | #171 | Average 5.5% |
| Immigrants | Austria | 51.3 /100 | #172 | Average 5.5% |
| Peruvians | 50.2 /100 | #173 | Average 5.5% |
| Immigrants | Laos | 50.0 /100 | #174 | Average 5.5% |
| Afghans | 49.6 /100 | #175 | Average 5.5% |