Immigrants from Venezuela vs Inupiat Unemployment Among Ages 25 to 29 years
COMPARE
Immigrants from Venezuela
Inupiat
Unemployment Among Ages 25 to 29 years
Unemployment Among Ages 25 to 29 years Comparison
Immigrants from Venezuela
Inupiat
6.0%
UNEMPLOYMENT AMONG AGES 25 TO 29 YEARS
99.8/ 100
METRIC RATING
23rd/ 347
METRIC RANK
13.4%
UNEMPLOYMENT AMONG AGES 25 TO 29 YEARS
0.0/ 100
METRIC RATING
343rd/ 347
METRIC RANK
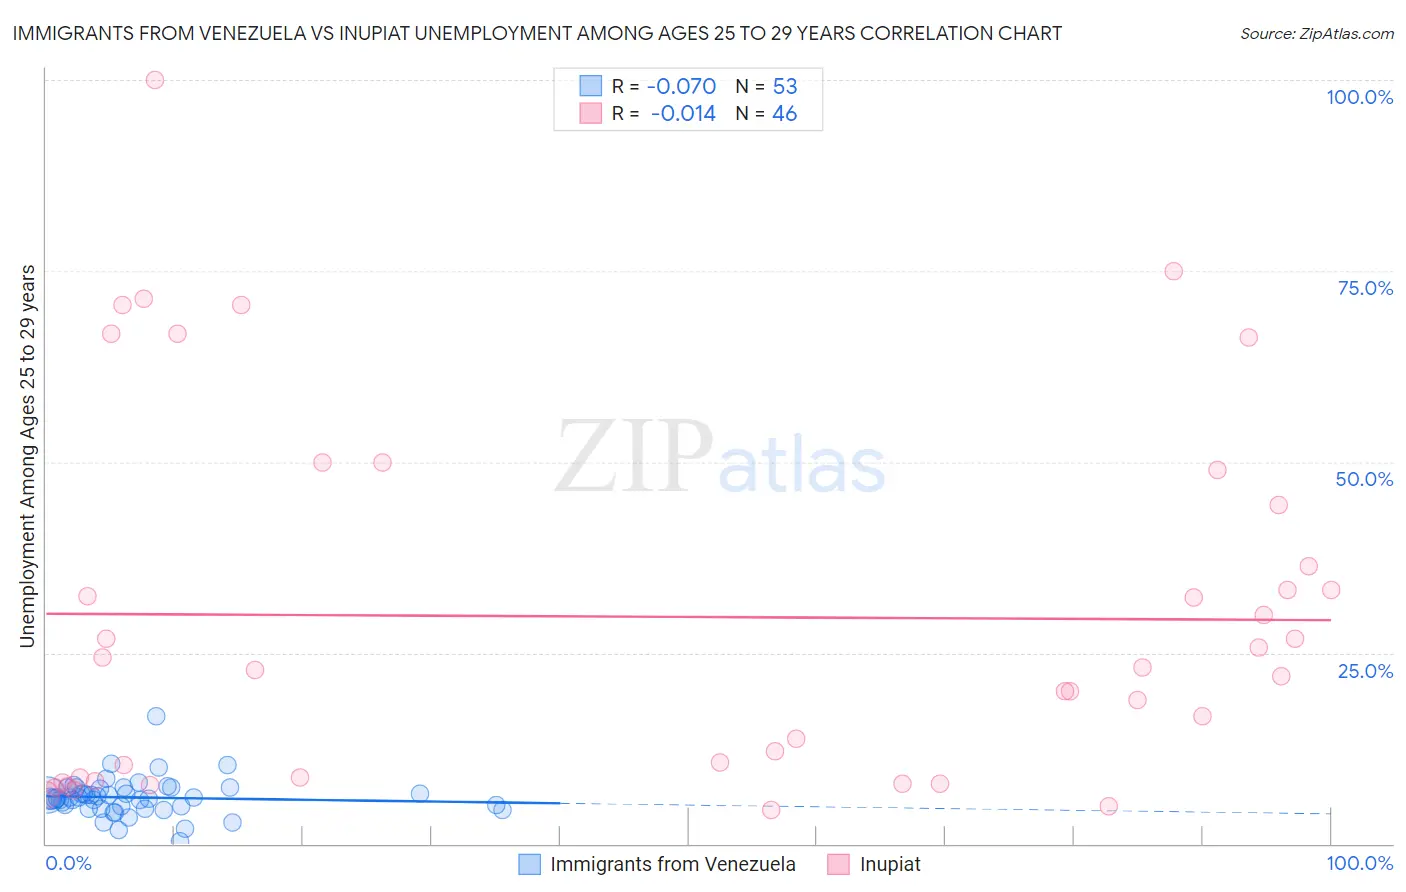
Immigrants from Venezuela vs Inupiat Unemployment Among Ages 25 to 29 years Correlation Chart
The statistical analysis conducted on geographies consisting of 279,140,891 people shows a slight negative correlation between the proportion of Immigrants from Venezuela and unemployment rate among population between the ages 25 and 29 in the United States with a correlation coefficient (R) of -0.070 and weighted average of 6.0%. Similarly, the statistical analysis conducted on geographies consisting of 94,919,463 people shows no correlation between the proportion of Inupiat and unemployment rate among population between the ages 25 and 29 in the United States with a correlation coefficient (R) of -0.014 and weighted average of 13.4%, a difference of 124.3%.
Unemployment Among Ages 25 to 29 years Correlation Summary
| Measurement | Immigrants from Venezuela | Inupiat |
| Minimum | 0.30% | 4.5% |
| Maximum | 16.7% | 100.0% |
| Range | 16.4% | 95.5% |
| Mean | 6.1% | 29.7% |
| Median | 6.0% | 22.9% |
| Interquartile 25% (IQ1) | 4.8% | 8.6% |
| Interquartile 75% (IQ3) | 7.2% | 44.4% |
| Interquartile Range (IQR) | 2.5% | 35.8% |
| Standard Deviation (Sample) | 2.5% | 24.1% |
| Standard Deviation (Population) | 2.4% | 23.9% |
Similar Demographics by Unemployment Among Ages 25 to 29 years
Demographics Similar to Immigrants from Venezuela by Unemployment Among Ages 25 to 29 years
In terms of unemployment among ages 25 to 29 years, the demographic groups most similar to Immigrants from Venezuela are Immigrants from Japan (6.0%, a difference of 0.060%), Norwegian (6.0%, a difference of 0.060%), Immigrants from Ethiopia (6.0%, a difference of 0.33%), Immigrants from Eritrea (5.9%, a difference of 0.67%), and New Zealander (6.0%, a difference of 0.69%).
| Demographics | Rating | Rank | Unemployment Among Ages 25 to 29 years |
| Immigrants | Bulgaria | 99.9 /100 | #16 | Exceptional 5.9% |
| Bolivians | 99.9 /100 | #17 | Exceptional 5.9% |
| Immigrants | Singapore | 99.9 /100 | #18 | Exceptional 5.9% |
| Thais | 99.9 /100 | #19 | Exceptional 5.9% |
| Immigrants | Eritrea | 99.9 /100 | #20 | Exceptional 5.9% |
| Immigrants | Ethiopia | 99.9 /100 | #21 | Exceptional 6.0% |
| Immigrants | Japan | 99.9 /100 | #22 | Exceptional 6.0% |
| Immigrants | Venezuela | 99.8 /100 | #23 | Exceptional 6.0% |
| Norwegians | 99.8 /100 | #24 | Exceptional 6.0% |
| New Zealanders | 99.8 /100 | #25 | Exceptional 6.0% |
| Immigrants | Eastern Africa | 99.8 /100 | #26 | Exceptional 6.0% |
| Immigrants | Zaire | 99.7 /100 | #27 | Exceptional 6.0% |
| Danes | 99.7 /100 | #28 | Exceptional 6.0% |
| Immigrants | South Central Asia | 99.7 /100 | #29 | Exceptional 6.1% |
| Bulgarians | 99.7 /100 | #30 | Exceptional 6.1% |
Demographics Similar to Inupiat by Unemployment Among Ages 25 to 29 years
In terms of unemployment among ages 25 to 29 years, the demographic groups most similar to Inupiat are Hopi (13.5%, a difference of 0.65%), Navajo (12.2%, a difference of 10.3%), Tohono O'odham (12.1%, a difference of 11.2%), Cheyenne (11.8%, a difference of 13.5%), and Pima (11.8%, a difference of 14.0%).
| Demographics | Rating | Rank | Unemployment Among Ages 25 to 29 years |
| Alaskan Athabascans | 0.0 /100 | #333 | Tragic 10.8% |
| Yuman | 0.0 /100 | #334 | Tragic 11.0% |
| Puerto Ricans | 0.0 /100 | #335 | Tragic 11.1% |
| Lumbee | 0.0 /100 | #336 | Tragic 11.2% |
| Menominee | 0.0 /100 | #337 | Tragic 11.3% |
| Sioux | 0.0 /100 | #338 | Tragic 11.7% |
| Pima | 0.0 /100 | #339 | Tragic 11.8% |
| Cheyenne | 0.0 /100 | #340 | Tragic 11.8% |
| Tohono O'odham | 0.0 /100 | #341 | Tragic 12.1% |
| Navajo | 0.0 /100 | #342 | Tragic 12.2% |
| Inupiat | 0.0 /100 | #343 | Tragic 13.4% |
| Hopi | 0.0 /100 | #344 | Tragic 13.5% |
| Arapaho | 0.0 /100 | #345 | Tragic 15.4% |
| Crow | 0.0 /100 | #346 | Tragic 15.4% |
| Yup'ik | 0.0 /100 | #347 | Tragic 17.9% |