Immigrants from Uzbekistan vs Immigrants from Israel Unemployment Among Ages 65 to 74 years
COMPARE
Immigrants from Uzbekistan
Immigrants from Israel
Unemployment Among Ages 65 to 74 years
Unemployment Among Ages 65 to 74 years Comparison
Immigrants from Uzbekistan
Immigrants from Israel
5.5%
UNEMPLOYMENT AMONG AGES 65 TO 74 YEARS
12.5/ 100
METRIC RATING
207th/ 347
METRIC RANK
5.5%
UNEMPLOYMENT AMONG AGES 65 TO 74 YEARS
3.0/ 100
METRIC RATING
228th/ 347
METRIC RANK
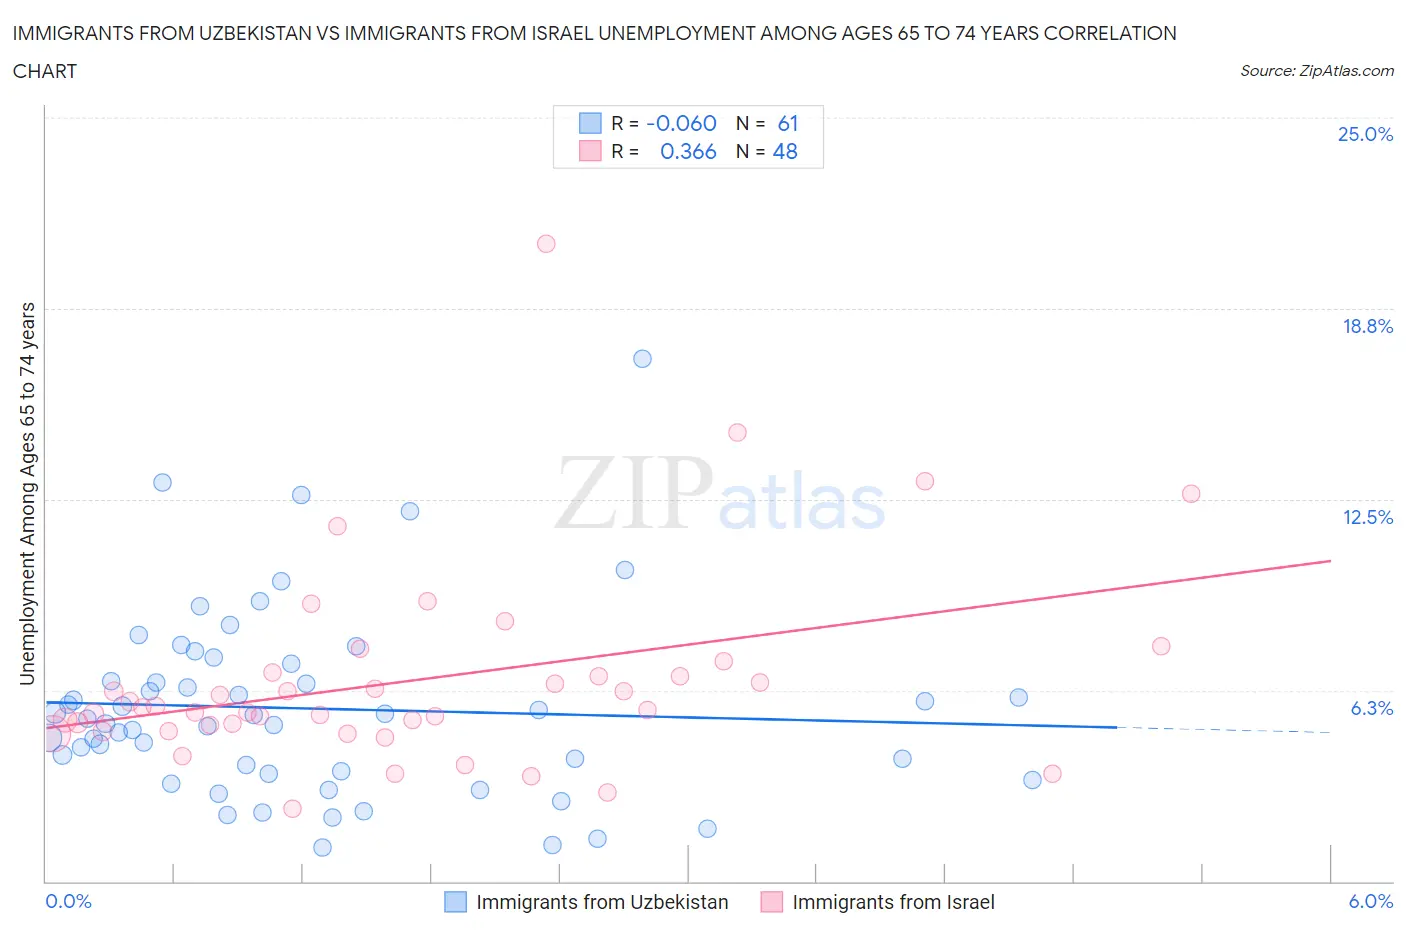
Immigrants from Uzbekistan vs Immigrants from Israel Unemployment Among Ages 65 to 74 years Correlation Chart
The statistical analysis conducted on geographies consisting of 114,524,649 people shows a slight negative correlation between the proportion of Immigrants from Uzbekistan and unemployment rate among population between the ages 65 and 74 in the United States with a correlation coefficient (R) of -0.060 and weighted average of 5.5%. Similarly, the statistical analysis conducted on geographies consisting of 198,614,946 people shows a mild positive correlation between the proportion of Immigrants from Israel and unemployment rate among population between the ages 65 and 74 in the United States with a correlation coefficient (R) of 0.366 and weighted average of 5.5%, a difference of 1.3%.
Unemployment Among Ages 65 to 74 years Correlation Summary
| Measurement | Immigrants from Uzbekistan | Immigrants from Israel |
| Minimum | 1.1% | 2.4% |
| Maximum | 17.1% | 20.9% |
| Range | 16.0% | 18.5% |
| Mean | 5.7% | 6.6% |
| Median | 5.3% | 5.6% |
| Interquartile 25% (IQ1) | 3.5% | 5.0% |
| Interquartile 75% (IQ3) | 6.8% | 6.8% |
| Interquartile Range (IQR) | 3.3% | 1.8% |
| Standard Deviation (Sample) | 3.1% | 3.3% |
| Standard Deviation (Population) | 3.0% | 3.2% |
Similar Demographics by Unemployment Among Ages 65 to 74 years
Demographics Similar to Immigrants from Uzbekistan by Unemployment Among Ages 65 to 74 years
In terms of unemployment among ages 65 to 74 years, the demographic groups most similar to Immigrants from Uzbekistan are African (5.5%, a difference of 0.020%), Dutch West Indian (5.5%, a difference of 0.080%), Seminole (5.4%, a difference of 0.12%), Icelander (5.4%, a difference of 0.12%), and Subsaharan African (5.4%, a difference of 0.13%).
| Demographics | Rating | Rank | Unemployment Among Ages 65 to 74 years |
| Immigrants | Pakistan | 15.2 /100 | #200 | Poor 5.4% |
| Immigrants | Western Asia | 14.9 /100 | #201 | Poor 5.4% |
| Sub-Saharan Africans | 14.4 /100 | #202 | Poor 5.4% |
| Argentineans | 14.3 /100 | #203 | Poor 5.4% |
| Seminole | 14.3 /100 | #204 | Poor 5.4% |
| Icelanders | 14.2 /100 | #205 | Poor 5.4% |
| Africans | 12.8 /100 | #206 | Poor 5.5% |
| Immigrants | Uzbekistan | 12.5 /100 | #207 | Poor 5.5% |
| Dutch West Indians | 11.5 /100 | #208 | Poor 5.5% |
| Immigrants | Honduras | 10.4 /100 | #209 | Poor 5.5% |
| Immigrants | Northern Africa | 10.1 /100 | #210 | Poor 5.5% |
| Immigrants | Croatia | 9.1 /100 | #211 | Tragic 5.5% |
| Haitians | 7.7 /100 | #212 | Tragic 5.5% |
| Italians | 7.7 /100 | #213 | Tragic 5.5% |
| Egyptians | 7.6 /100 | #214 | Tragic 5.5% |
Demographics Similar to Immigrants from Israel by Unemployment Among Ages 65 to 74 years
In terms of unemployment among ages 65 to 74 years, the demographic groups most similar to Immigrants from Israel are West Indian (5.5%, a difference of 0.080%), Immigrants from Caribbean (5.5%, a difference of 0.10%), Israeli (5.5%, a difference of 0.14%), Nigerian (5.5%, a difference of 0.15%), and Honduran (5.5%, a difference of 0.18%).
| Demographics | Rating | Rank | Unemployment Among Ages 65 to 74 years |
| Spaniards | 4.8 /100 | #221 | Tragic 5.5% |
| Apache | 4.5 /100 | #222 | Tragic 5.5% |
| Hungarians | 4.4 /100 | #223 | Tragic 5.5% |
| Immigrants | Uruguay | 4.2 /100 | #224 | Tragic 5.5% |
| Immigrants | Trinidad and Tobago | 4.1 /100 | #225 | Tragic 5.5% |
| Hondurans | 3.7 /100 | #226 | Tragic 5.5% |
| Immigrants | Albania | 3.7 /100 | #227 | Tragic 5.5% |
| Immigrants | Israel | 3.0 /100 | #228 | Tragic 5.5% |
| West Indians | 2.7 /100 | #229 | Tragic 5.5% |
| Immigrants | Caribbean | 2.7 /100 | #230 | Tragic 5.5% |
| Israelis | 2.5 /100 | #231 | Tragic 5.5% |
| Nigerians | 2.5 /100 | #232 | Tragic 5.5% |
| South American Indians | 2.3 /100 | #233 | Tragic 5.5% |
| French American Indians | 2.2 /100 | #234 | Tragic 5.5% |
| Peruvians | 2.2 /100 | #235 | Tragic 5.5% |