Immigrants from Uruguay vs Pennsylvania German Unemployment Among Seniors over 65 years
COMPARE
Immigrants from Uruguay
Pennsylvania German
Unemployment Among Seniors over 65 years
Unemployment Among Seniors over 65 years Comparison
Immigrants from Uruguay
Pennsylvania Germans
5.2%
UNEMPLOYMENT AMONG SENIORS OVER 65 YEARS
9.3/ 100
METRIC RATING
213th/ 347
METRIC RANK
5.4%
UNEMPLOYMENT AMONG SENIORS OVER 65 YEARS
0.2/ 100
METRIC RATING
266th/ 347
METRIC RANK
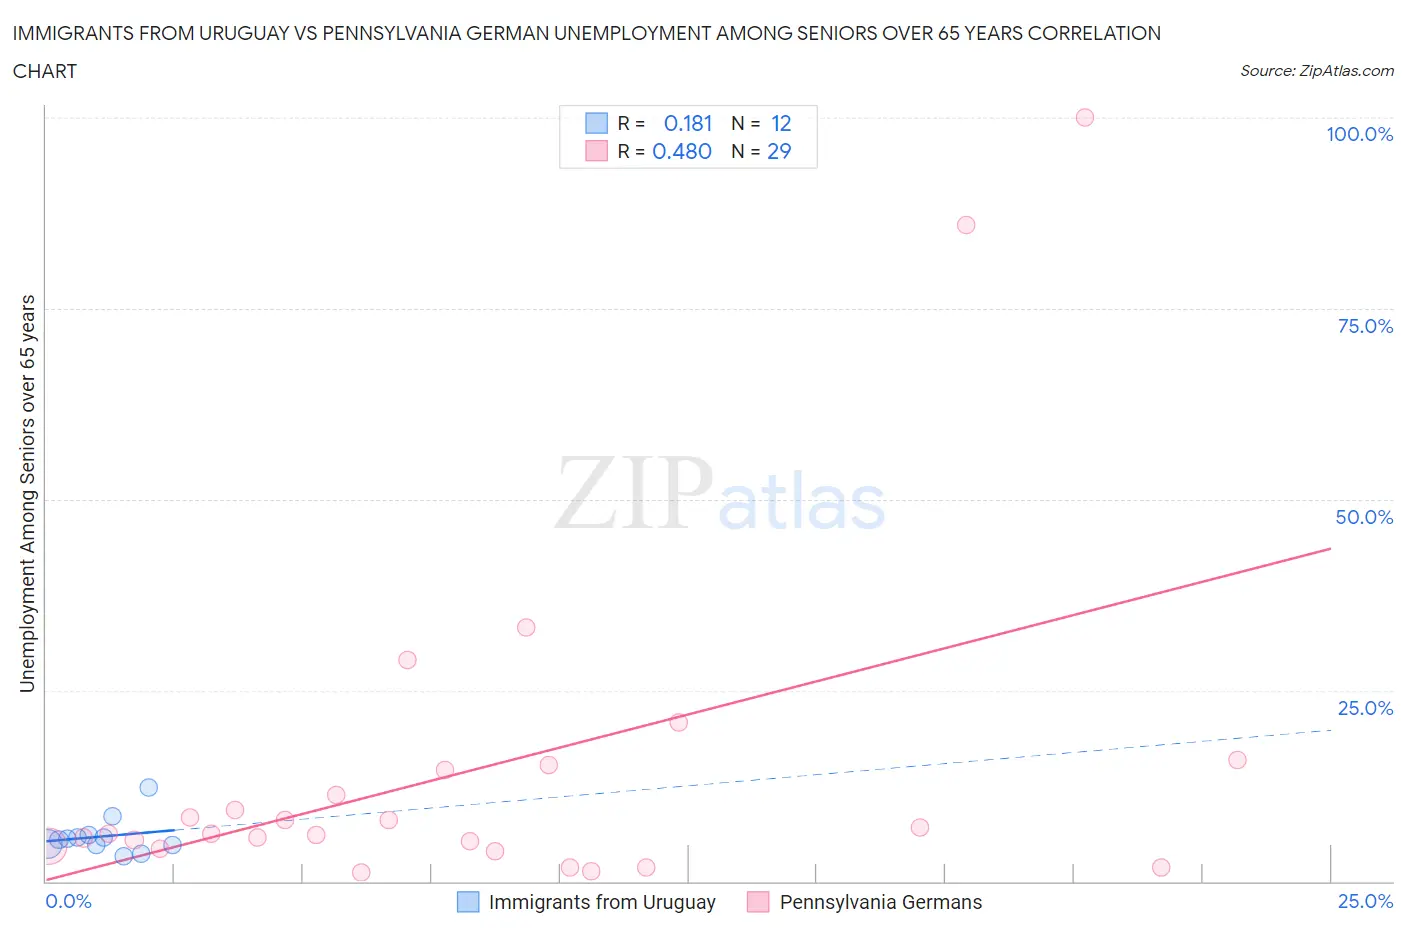
Immigrants from Uruguay vs Pennsylvania German Unemployment Among Seniors over 65 years Correlation Chart
The statistical analysis conducted on geographies consisting of 129,178,581 people shows a poor positive correlation between the proportion of Immigrants from Uruguay and unemployment rate amomg seniors over the age of 65 in the United States with a correlation coefficient (R) of 0.181 and weighted average of 5.2%. Similarly, the statistical analysis conducted on geographies consisting of 210,695,157 people shows a moderate positive correlation between the proportion of Pennsylvania Germans and unemployment rate amomg seniors over the age of 65 in the United States with a correlation coefficient (R) of 0.480 and weighted average of 5.4%, a difference of 3.2%.
Unemployment Among Seniors over 65 years Correlation Summary
| Measurement | Immigrants from Uruguay | Pennsylvania German |
| Minimum | 3.2% | 1.2% |
| Maximum | 12.2% | 100.0% |
| Range | 9.0% | 98.8% |
| Mean | 5.9% | 14.7% |
| Median | 5.5% | 6.2% |
| Interquartile 25% (IQ1) | 4.7% | 4.5% |
| Interquartile 75% (IQ3) | 5.9% | 14.9% |
| Interquartile Range (IQR) | 1.2% | 10.4% |
| Standard Deviation (Sample) | 2.4% | 23.1% |
| Standard Deviation (Population) | 2.3% | 22.7% |
Similar Demographics by Unemployment Among Seniors over 65 years
Demographics Similar to Immigrants from Uruguay by Unemployment Among Seniors over 65 years
In terms of unemployment among seniors over 65 years, the demographic groups most similar to Immigrants from Uruguay are Albanian (5.2%, a difference of 0.030%), Immigrants from Fiji (5.2%, a difference of 0.070%), Immigrants from Honduras (5.2%, a difference of 0.080%), Cajun (5.2%, a difference of 0.080%), and African (5.2%, a difference of 0.090%).
| Demographics | Rating | Rank | Unemployment Among Seniors over 65 years |
| German Russians | 14.7 /100 | #206 | Poor 5.2% |
| Immigrants | Philippines | 13.2 /100 | #207 | Poor 5.2% |
| Uruguayans | 12.6 /100 | #208 | Poor 5.2% |
| Alsatians | 11.4 /100 | #209 | Poor 5.2% |
| Immigrants | Uzbekistan | 10.7 /100 | #210 | Poor 5.2% |
| Africans | 10.4 /100 | #211 | Poor 5.2% |
| Immigrants | Honduras | 10.2 /100 | #212 | Poor 5.2% |
| Immigrants | Uruguay | 9.3 /100 | #213 | Tragic 5.2% |
| Albanians | 9.1 /100 | #214 | Tragic 5.2% |
| Immigrants | Fiji | 8.6 /100 | #215 | Tragic 5.2% |
| Cajuns | 8.5 /100 | #216 | Tragic 5.2% |
| Italians | 8.3 /100 | #217 | Tragic 5.2% |
| Spaniards | 7.4 /100 | #218 | Tragic 5.2% |
| Dutch West Indians | 6.9 /100 | #219 | Tragic 5.3% |
| Egyptians | 6.4 /100 | #220 | Tragic 5.3% |
Demographics Similar to Pennsylvania Germans by Unemployment Among Seniors over 65 years
In terms of unemployment among seniors over 65 years, the demographic groups most similar to Pennsylvania Germans are Chippewa (5.4%, a difference of 0.0%), Immigrants from Colombia (5.4%, a difference of 0.020%), Central American Indian (5.4%, a difference of 0.030%), Hawaiian (5.4%, a difference of 0.11%), and South American (5.4%, a difference of 0.15%).
| Demographics | Rating | Rank | Unemployment Among Seniors over 65 years |
| Immigrants | Ghana | 0.4 /100 | #259 | Tragic 5.4% |
| Native Hawaiians | 0.3 /100 | #260 | Tragic 5.4% |
| Spanish American Indians | 0.2 /100 | #261 | Tragic 5.4% |
| Immigrants | Grenada | 0.2 /100 | #262 | Tragic 5.4% |
| South Americans | 0.2 /100 | #263 | Tragic 5.4% |
| Central American Indians | 0.2 /100 | #264 | Tragic 5.4% |
| Immigrants | Colombia | 0.2 /100 | #265 | Tragic 5.4% |
| Pennsylvania Germans | 0.2 /100 | #266 | Tragic 5.4% |
| Chippewa | 0.2 /100 | #267 | Tragic 5.4% |
| Hawaiians | 0.1 /100 | #268 | Tragic 5.4% |
| Immigrants | Southern Europe | 0.1 /100 | #269 | Tragic 5.4% |
| Immigrants | Morocco | 0.1 /100 | #270 | Tragic 5.4% |
| Cypriots | 0.1 /100 | #271 | Tragic 5.4% |
| Immigrants | Jamaica | 0.1 /100 | #272 | Tragic 5.4% |
| Immigrants | Nigeria | 0.1 /100 | #273 | Tragic 5.4% |