Immigrants from Uruguay vs Kenyan Unemployment Among Ages 20 to 24 years
COMPARE
Immigrants from Uruguay
Kenyan
Unemployment Among Ages 20 to 24 years
Unemployment Among Ages 20 to 24 years Comparison
Immigrants from Uruguay
Kenyans
10.1%
UNEMPLOYMENT AMONG AGES 20 TO 24 YEARS
89.6/ 100
METRIC RATING
117th/ 347
METRIC RANK
9.9%
UNEMPLOYMENT AMONG AGES 20 TO 24 YEARS
98.7/ 100
METRIC RATING
73rd/ 347
METRIC RANK
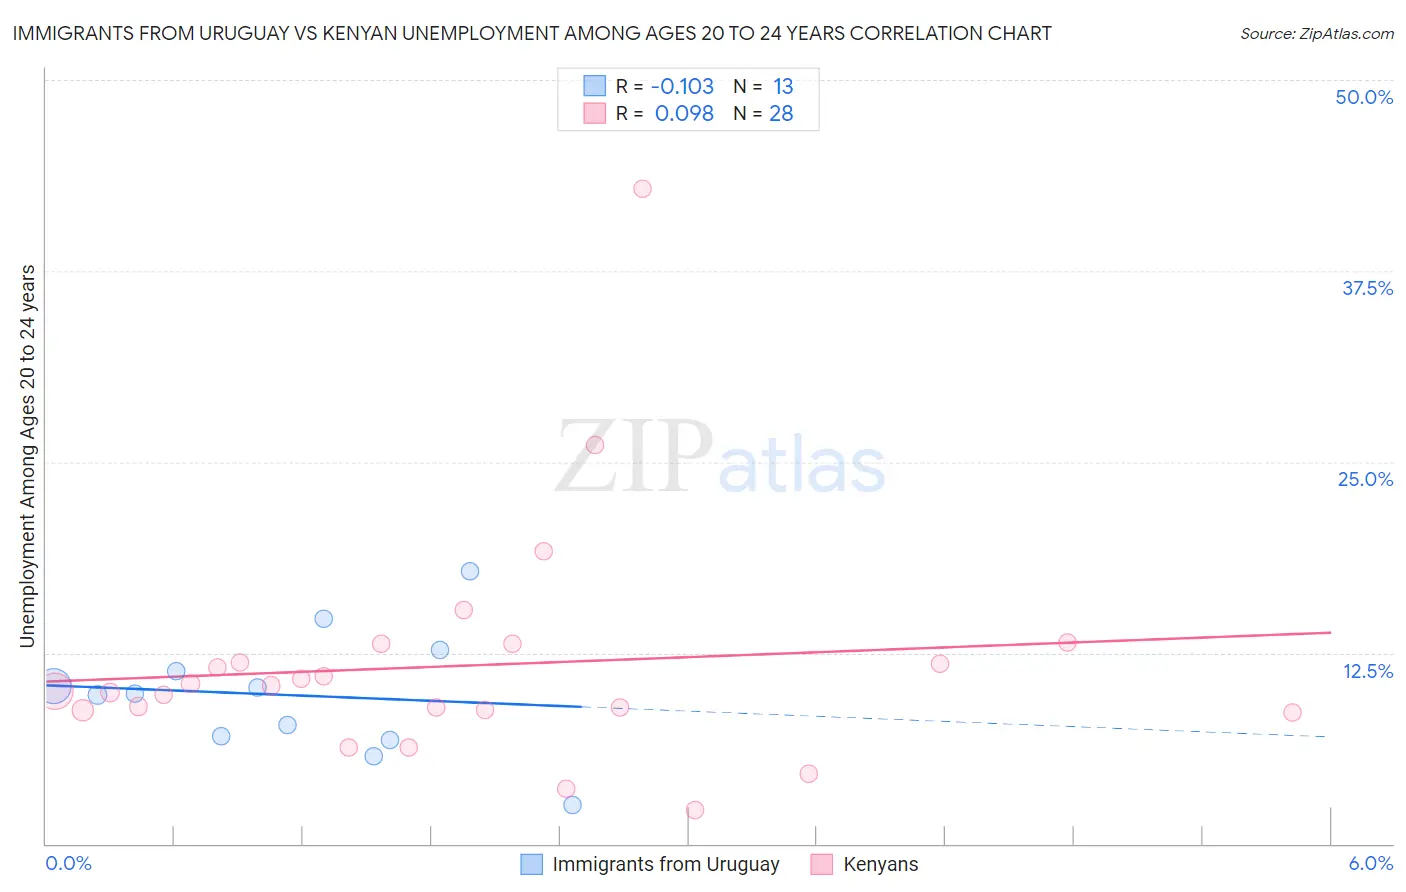
Immigrants from Uruguay vs Kenyan Unemployment Among Ages 20 to 24 years Correlation Chart
The statistical analysis conducted on geographies consisting of 131,967,308 people shows a poor negative correlation between the proportion of Immigrants from Uruguay and unemployment rate among population between the ages 20 and 24 in the United States with a correlation coefficient (R) of -0.103 and weighted average of 10.1%. Similarly, the statistical analysis conducted on geographies consisting of 166,817,743 people shows a slight positive correlation between the proportion of Kenyans and unemployment rate among population between the ages 20 and 24 in the United States with a correlation coefficient (R) of 0.098 and weighted average of 9.9%, a difference of 2.1%.
Unemployment Among Ages 20 to 24 years Correlation Summary
| Measurement | Immigrants from Uruguay | Kenyan |
| Minimum | 2.5% | 2.2% |
| Maximum | 17.8% | 42.9% |
| Range | 15.3% | 40.7% |
| Mean | 9.7% | 11.6% |
| Median | 9.8% | 10.2% |
| Interquartile 25% (IQ1) | 6.9% | 8.7% |
| Interquartile 75% (IQ3) | 12.0% | 12.5% |
| Interquartile Range (IQR) | 5.1% | 3.7% |
| Standard Deviation (Sample) | 4.0% | 7.7% |
| Standard Deviation (Population) | 3.8% | 7.5% |
Similar Demographics by Unemployment Among Ages 20 to 24 years
Demographics Similar to Immigrants from Uruguay by Unemployment Among Ages 20 to 24 years
In terms of unemployment among ages 20 to 24 years, the demographic groups most similar to Immigrants from Uruguay are Basque (10.1%, a difference of 0.010%), Immigrants from Morocco (10.1%, a difference of 0.090%), Paraguayan (10.1%, a difference of 0.10%), Ottawa (10.1%, a difference of 0.13%), and French (10.1%, a difference of 0.13%).
| Demographics | Rating | Rank | Unemployment Among Ages 20 to 24 years |
| Immigrants | Spain | 93.1 /100 | #110 | Exceptional 10.1% |
| Immigrants | Indonesia | 92.7 /100 | #111 | Exceptional 10.1% |
| Northern Europeans | 92.7 /100 | #112 | Exceptional 10.1% |
| German Russians | 92.4 /100 | #113 | Exceptional 10.1% |
| Ottawa | 90.8 /100 | #114 | Exceptional 10.1% |
| Immigrants | Morocco | 90.5 /100 | #115 | Exceptional 10.1% |
| Basques | 89.8 /100 | #116 | Excellent 10.1% |
| Immigrants | Uruguay | 89.6 /100 | #117 | Excellent 10.1% |
| Paraguayans | 88.6 /100 | #118 | Excellent 10.1% |
| French | 88.2 /100 | #119 | Excellent 10.1% |
| Immigrants | Canada | 88.2 /100 | #120 | Excellent 10.1% |
| South Africans | 87.8 /100 | #121 | Excellent 10.1% |
| Whites/Caucasians | 87.4 /100 | #122 | Excellent 10.1% |
| Immigrants | Iraq | 87.1 /100 | #123 | Excellent 10.1% |
| Immigrants | Japan | 86.5 /100 | #124 | Excellent 10.1% |
Demographics Similar to Kenyans by Unemployment Among Ages 20 to 24 years
In terms of unemployment among ages 20 to 24 years, the demographic groups most similar to Kenyans are Immigrants from Laos (9.9%, a difference of 0.030%), Immigrants from Australia (9.9%, a difference of 0.10%), Bolivian (9.9%, a difference of 0.14%), Celtic (9.9%, a difference of 0.18%), and Czechoslovakian (9.9%, a difference of 0.19%).
| Demographics | Rating | Rank | Unemployment Among Ages 20 to 24 years |
| Scottish | 99.3 /100 | #66 | Exceptional 9.8% |
| Immigrants | Bolivia | 99.2 /100 | #67 | Exceptional 9.9% |
| Mongolians | 99.1 /100 | #68 | Exceptional 9.9% |
| Bulgarians | 99.1 /100 | #69 | Exceptional 9.9% |
| Immigrants | Croatia | 99.0 /100 | #70 | Exceptional 9.9% |
| Celtics | 98.9 /100 | #71 | Exceptional 9.9% |
| Bolivians | 98.9 /100 | #72 | Exceptional 9.9% |
| Kenyans | 98.7 /100 | #73 | Exceptional 9.9% |
| Immigrants | Laos | 98.7 /100 | #74 | Exceptional 9.9% |
| Immigrants | Australia | 98.6 /100 | #75 | Exceptional 9.9% |
| Czechoslovakians | 98.4 /100 | #76 | Exceptional 9.9% |
| Chickasaw | 98.4 /100 | #77 | Exceptional 9.9% |
| Assyrians/Chaldeans/Syriacs | 98.3 /100 | #78 | Exceptional 9.9% |
| Icelanders | 98.3 /100 | #79 | Exceptional 9.9% |
| Immigrants | Netherlands | 98.2 /100 | #80 | Exceptional 9.9% |