Immigrants from Uruguay vs Immigrants from Panama Unemployment Among Youth under 25 years
COMPARE
Immigrants from Uruguay
Immigrants from Panama
Unemployment Among Youth under 25 years
Unemployment Among Youth under 25 years Comparison
Immigrants from Uruguay
Immigrants from Panama
11.5%
UNEMPLOYMENT AMONG YOUTH UNDER 25 YEARS
76.1/ 100
METRIC RATING
141st/ 347
METRIC RANK
12.4%
UNEMPLOYMENT AMONG YOUTH UNDER 25 YEARS
0.1/ 100
METRIC RATING
260th/ 347
METRIC RANK
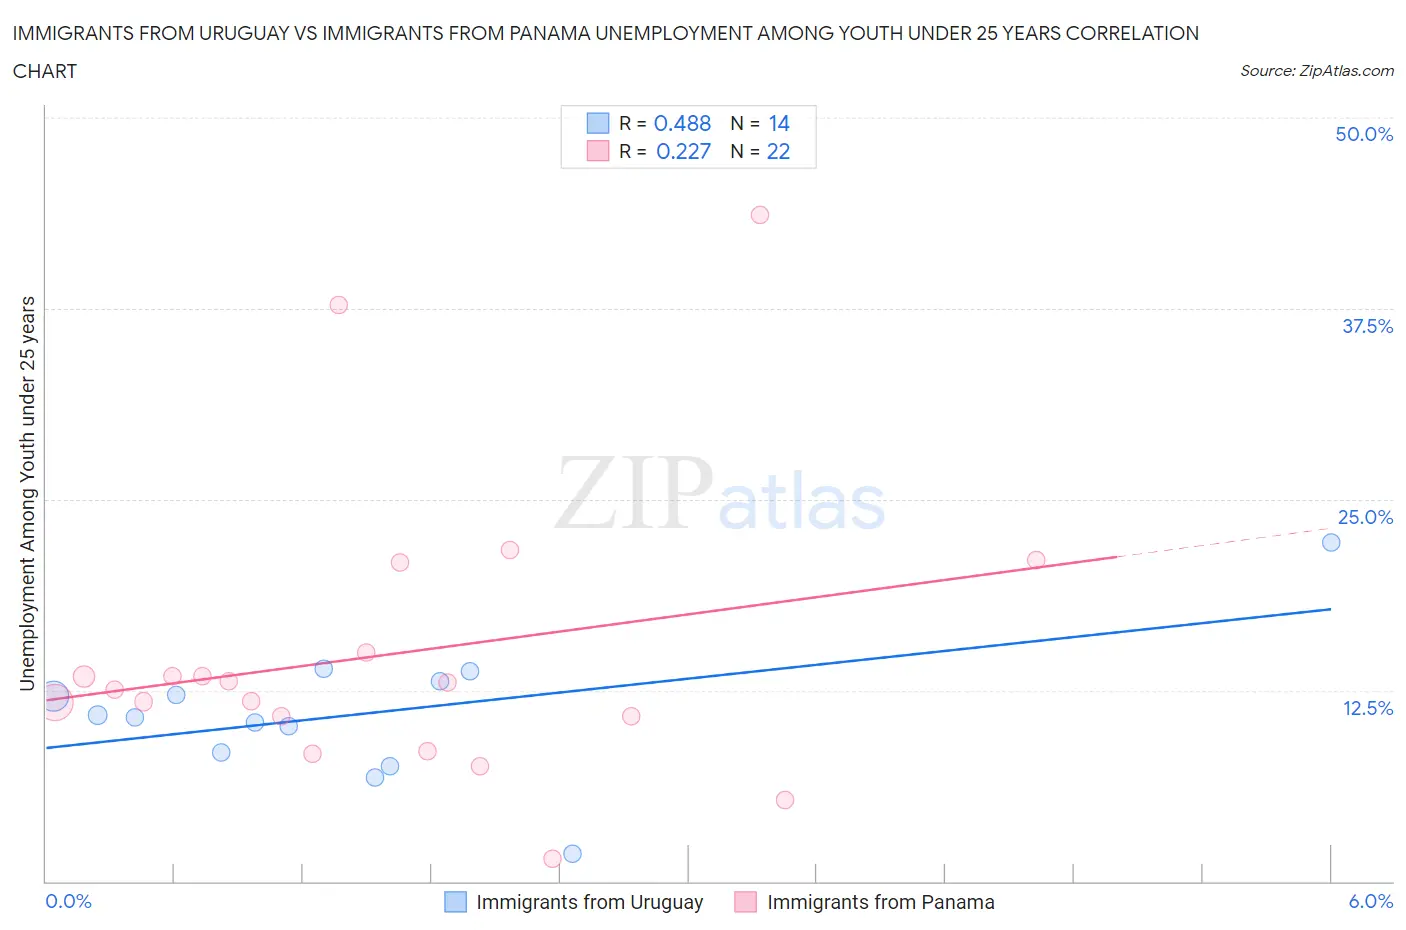
Immigrants from Uruguay vs Immigrants from Panama Unemployment Among Youth under 25 years Correlation Chart
The statistical analysis conducted on geographies consisting of 132,844,983 people shows a moderate positive correlation between the proportion of Immigrants from Uruguay and unemployment rate among youth under the age of 25 in the United States with a correlation coefficient (R) of 0.488 and weighted average of 11.5%. Similarly, the statistical analysis conducted on geographies consisting of 220,278,494 people shows a weak positive correlation between the proportion of Immigrants from Panama and unemployment rate among youth under the age of 25 in the United States with a correlation coefficient (R) of 0.227 and weighted average of 12.4%, a difference of 8.4%.
Unemployment Among Youth under 25 years Correlation Summary
| Measurement | Immigrants from Uruguay | Immigrants from Panama |
| Minimum | 1.8% | 1.5% |
| Maximum | 22.2% | 43.6% |
| Range | 20.4% | 42.1% |
| Mean | 11.0% | 14.9% |
| Median | 10.8% | 12.8% |
| Interquartile 25% (IQ1) | 8.4% | 10.8% |
| Interquartile 75% (IQ3) | 13.1% | 15.0% |
| Interquartile Range (IQR) | 4.7% | 4.2% |
| Standard Deviation (Sample) | 4.6% | 9.6% |
| Standard Deviation (Population) | 4.4% | 9.4% |
Similar Demographics by Unemployment Among Youth under 25 years
Demographics Similar to Immigrants from Uruguay by Unemployment Among Youth under 25 years
In terms of unemployment among youth under 25 years, the demographic groups most similar to Immigrants from Uruguay are Immigrants from Korea (11.5%, a difference of 0.050%), Immigrants from Indonesia (11.5%, a difference of 0.090%), Immigrants from Belgium (11.5%, a difference of 0.090%), Immigrants from Uganda (11.5%, a difference of 0.090%), and Immigrants from Brazil (11.5%, a difference of 0.10%).
| Demographics | Rating | Rank | Unemployment Among Youth under 25 years |
| Immigrants | Chile | 80.4 /100 | #134 | Excellent 11.4% |
| Immigrants | Oceania | 80.2 /100 | #135 | Excellent 11.4% |
| Romanians | 80.1 /100 | #136 | Excellent 11.4% |
| Asians | 79.7 /100 | #137 | Good 11.4% |
| Immigrants | England | 78.1 /100 | #138 | Good 11.5% |
| Immigrants | Indonesia | 77.6 /100 | #139 | Good 11.5% |
| Immigrants | Belgium | 77.5 /100 | #140 | Good 11.5% |
| Immigrants | Uruguay | 76.1 /100 | #141 | Good 11.5% |
| Immigrants | Korea | 75.1 /100 | #142 | Good 11.5% |
| Immigrants | Uganda | 74.5 /100 | #143 | Good 11.5% |
| Immigrants | Brazil | 74.3 /100 | #144 | Good 11.5% |
| Argentineans | 73.0 /100 | #145 | Good 11.5% |
| Brazilians | 72.5 /100 | #146 | Good 11.5% |
| Laotians | 72.4 /100 | #147 | Good 11.5% |
| Immigrants | Northern Europe | 72.1 /100 | #148 | Good 11.5% |
Demographics Similar to Immigrants from Panama by Unemployment Among Youth under 25 years
In terms of unemployment among youth under 25 years, the demographic groups most similar to Immigrants from Panama are Immigrants from El Salvador (12.4%, a difference of 0.010%), Immigrants from Mexico (12.4%, a difference of 0.060%), Cree (12.4%, a difference of 0.16%), Immigrants from Central America (12.4%, a difference of 0.30%), and Salvadoran (12.4%, a difference of 0.35%).
| Demographics | Rating | Rank | Unemployment Among Youth under 25 years |
| Mexicans | 0.3 /100 | #253 | Tragic 12.3% |
| Hondurans | 0.3 /100 | #254 | Tragic 12.3% |
| Hispanics or Latinos | 0.2 /100 | #255 | Tragic 12.4% |
| Liberians | 0.2 /100 | #256 | Tragic 12.4% |
| Panamanians | 0.2 /100 | #257 | Tragic 12.4% |
| Salvadorans | 0.1 /100 | #258 | Tragic 12.4% |
| Immigrants | Central America | 0.1 /100 | #259 | Tragic 12.4% |
| Immigrants | Panama | 0.1 /100 | #260 | Tragic 12.4% |
| Immigrants | El Salvador | 0.1 /100 | #261 | Tragic 12.4% |
| Immigrants | Mexico | 0.1 /100 | #262 | Tragic 12.4% |
| Cree | 0.1 /100 | #263 | Tragic 12.4% |
| Puget Sound Salish | 0.1 /100 | #264 | Tragic 12.5% |
| Nepalese | 0.0 /100 | #265 | Tragic 12.5% |
| Immigrants | Latin America | 0.0 /100 | #266 | Tragic 12.6% |
| Sub-Saharan Africans | 0.0 /100 | #267 | Tragic 12.6% |