Immigrants from Turkey vs Asian Unemployment Among Ages 30 to 34 years
COMPARE
Immigrants from Turkey
Asian
Unemployment Among Ages 30 to 34 years
Unemployment Among Ages 30 to 34 years Comparison
Immigrants from Turkey
Asians
5.0%
UNEMPLOYMENT AMONG AGES 30 TO 34 YEARS
99.0/ 100
METRIC RATING
37th/ 347
METRIC RANK
5.1%
UNEMPLOYMENT AMONG AGES 30 TO 34 YEARS
97.2/ 100
METRIC RATING
58th/ 347
METRIC RANK
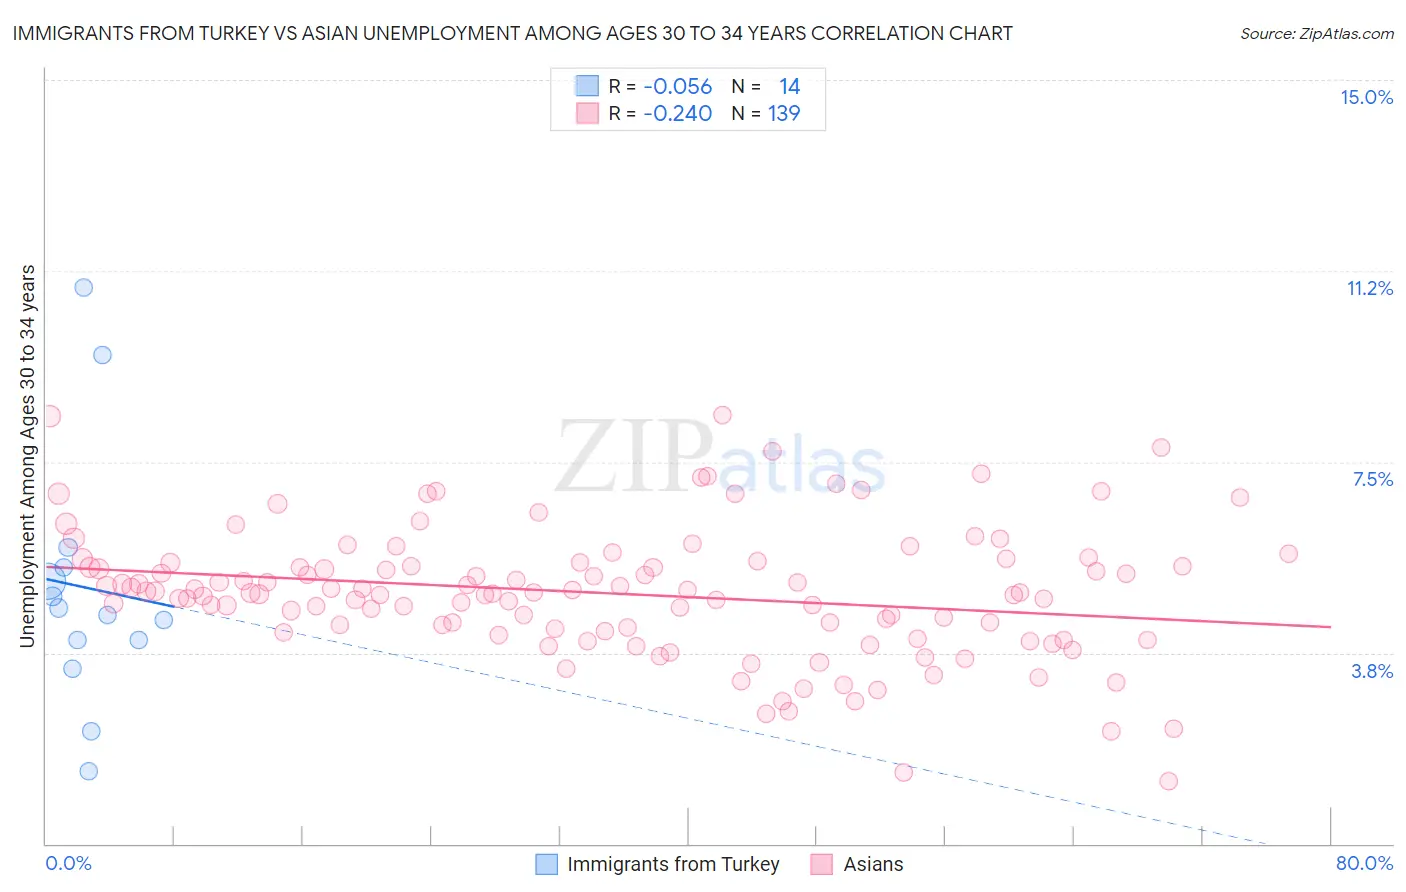
Immigrants from Turkey vs Asian Unemployment Among Ages 30 to 34 years Correlation Chart
The statistical analysis conducted on geographies consisting of 215,515,010 people shows a slight negative correlation between the proportion of Immigrants from Turkey and unemployment rate among population between the ages 30 and 34 in the United States with a correlation coefficient (R) of -0.056 and weighted average of 5.0%. Similarly, the statistical analysis conducted on geographies consisting of 491,020,616 people shows a weak negative correlation between the proportion of Asians and unemployment rate among population between the ages 30 and 34 in the United States with a correlation coefficient (R) of -0.240 and weighted average of 5.1%, a difference of 2.0%.
Unemployment Among Ages 30 to 34 years Correlation Summary
| Measurement | Immigrants from Turkey | Asian |
| Minimum | 1.4% | 1.2% |
| Maximum | 10.9% | 8.4% |
| Range | 9.5% | 7.2% |
| Mean | 5.0% | 4.9% |
| Median | 4.6% | 4.9% |
| Interquartile 25% (IQ1) | 4.0% | 4.2% |
| Interquartile 75% (IQ3) | 5.4% | 5.5% |
| Interquartile Range (IQR) | 1.4% | 1.3% |
| Standard Deviation (Sample) | 2.5% | 1.3% |
| Standard Deviation (Population) | 2.4% | 1.3% |
Similar Demographics by Unemployment Among Ages 30 to 34 years
Demographics Similar to Immigrants from Turkey by Unemployment Among Ages 30 to 34 years
In terms of unemployment among ages 30 to 34 years, the demographic groups most similar to Immigrants from Turkey are Sri Lankan (5.0%, a difference of 0.0%), Fijian (5.0%, a difference of 0.10%), Immigrants from Vietnam (5.0%, a difference of 0.19%), Immigrants from Eastern Africa (5.0%, a difference of 0.19%), and Czech (5.0%, a difference of 0.25%).
| Demographics | Rating | Rank | Unemployment Among Ages 30 to 34 years |
| Norwegians | 99.4 /100 | #30 | Exceptional 5.0% |
| Somalis | 99.3 /100 | #31 | Exceptional 5.0% |
| Immigrants | Zaire | 99.3 /100 | #32 | Exceptional 5.0% |
| Immigrants | Saudi Arabia | 99.3 /100 | #33 | Exceptional 5.0% |
| Latvians | 99.3 /100 | #34 | Exceptional 5.0% |
| Immigrants | Ethiopia | 99.2 /100 | #35 | Exceptional 5.0% |
| Czechs | 99.2 /100 | #36 | Exceptional 5.0% |
| Immigrants | Turkey | 99.0 /100 | #37 | Exceptional 5.0% |
| Sri Lankans | 99.0 /100 | #38 | Exceptional 5.0% |
| Fijians | 99.0 /100 | #39 | Exceptional 5.0% |
| Immigrants | Vietnam | 98.9 /100 | #40 | Exceptional 5.0% |
| Immigrants | Eastern Africa | 98.9 /100 | #41 | Exceptional 5.0% |
| Immigrants | Hong Kong | 98.8 /100 | #42 | Exceptional 5.0% |
| Soviet Union | 98.8 /100 | #43 | Exceptional 5.0% |
| Immigrants | Belgium | 98.7 /100 | #44 | Exceptional 5.1% |
Demographics Similar to Asians by Unemployment Among Ages 30 to 34 years
In terms of unemployment among ages 30 to 34 years, the demographic groups most similar to Asians are Immigrants from China (5.1%, a difference of 0.0%), Swedish (5.1%, a difference of 0.080%), Immigrants from Somalia (5.1%, a difference of 0.090%), Indian (Asian) (5.1%, a difference of 0.12%), and Immigrants from France (5.1%, a difference of 0.14%).
| Demographics | Rating | Rank | Unemployment Among Ages 30 to 34 years |
| Turks | 98.2 /100 | #51 | Exceptional 5.1% |
| Immigrants | Burma/Myanmar | 98.1 /100 | #52 | Exceptional 5.1% |
| Cubans | 98.1 /100 | #53 | Exceptional 5.1% |
| Immigrants | Morocco | 97.9 /100 | #54 | Exceptional 5.1% |
| Chinese | 97.7 /100 | #55 | Exceptional 5.1% |
| Immigrants | Serbia | 97.4 /100 | #56 | Exceptional 5.1% |
| Immigrants | China | 97.2 /100 | #57 | Exceptional 5.1% |
| Asians | 97.2 /100 | #58 | Exceptional 5.1% |
| Swedes | 97.1 /100 | #59 | Exceptional 5.1% |
| Immigrants | Somalia | 97.1 /100 | #60 | Exceptional 5.1% |
| Indians (Asian) | 97.0 /100 | #61 | Exceptional 5.1% |
| Immigrants | France | 97.0 /100 | #62 | Exceptional 5.1% |
| Belgians | 97.0 /100 | #63 | Exceptional 5.1% |
| Immigrants | Eastern Asia | 96.9 /100 | #64 | Exceptional 5.1% |
| Immigrants | Japan | 96.8 /100 | #65 | Exceptional 5.1% |