Immigrants from Trinidad and Tobago vs Sierra Leonean Unemployment Among Ages 30 to 34 years
COMPARE
Immigrants from Trinidad and Tobago
Sierra Leonean
Unemployment Among Ages 30 to 34 years
Unemployment Among Ages 30 to 34 years Comparison
Immigrants from Trinidad and Tobago
Sierra Leoneans
6.5%
UNEMPLOYMENT AMONG AGES 30 TO 34 YEARS
0.0/ 100
METRIC RATING
290th/ 347
METRIC RANK
5.8%
UNEMPLOYMENT AMONG AGES 30 TO 34 YEARS
3.9/ 100
METRIC RATING
220th/ 347
METRIC RANK
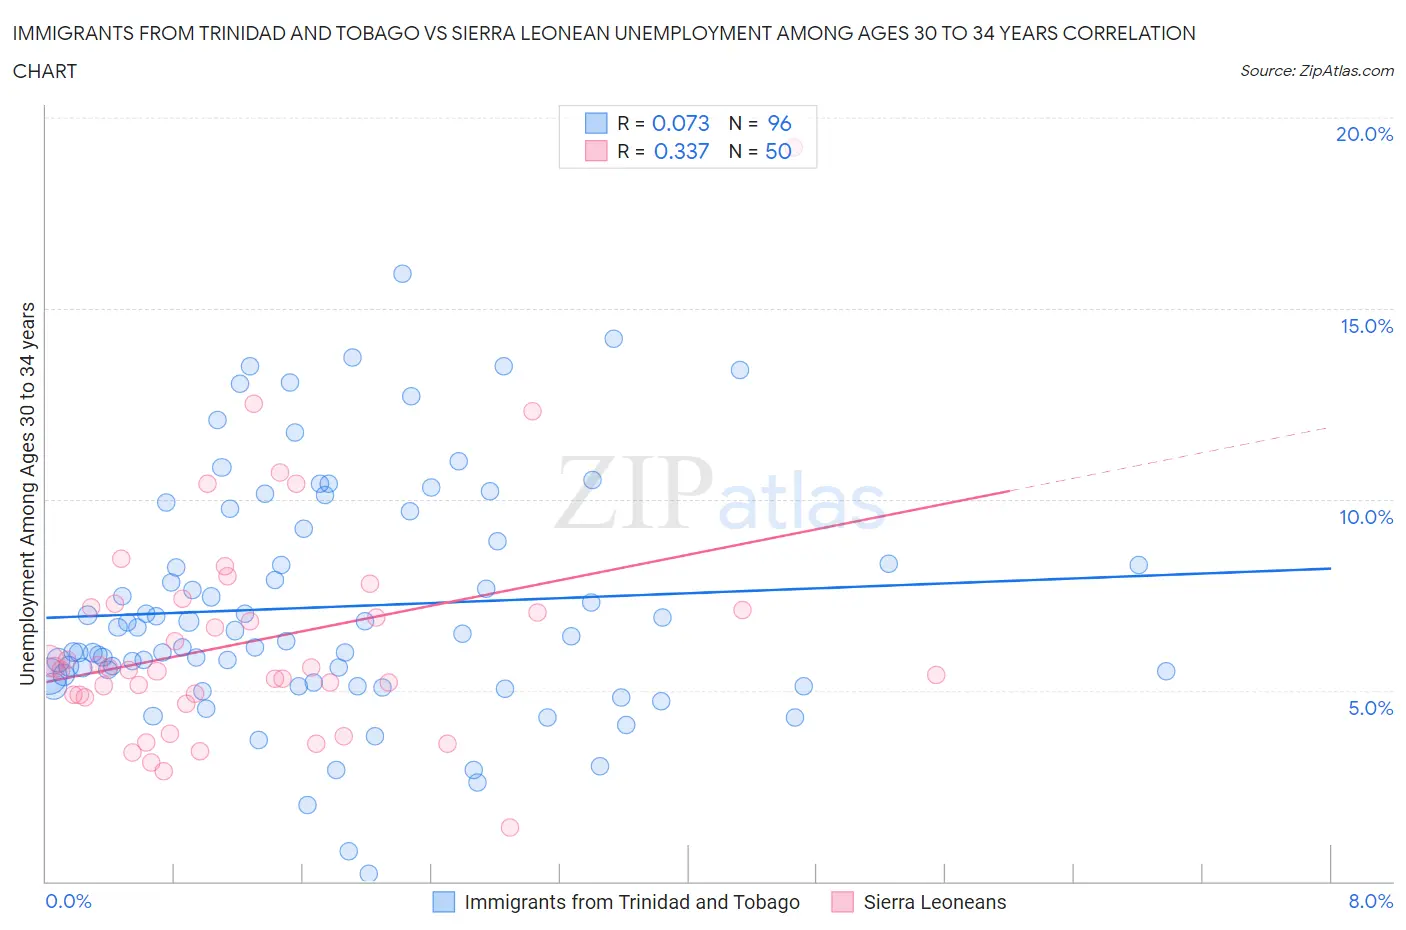
Immigrants from Trinidad and Tobago vs Sierra Leonean Unemployment Among Ages 30 to 34 years Correlation Chart
The statistical analysis conducted on geographies consisting of 216,772,578 people shows a slight positive correlation between the proportion of Immigrants from Trinidad and Tobago and unemployment rate among population between the ages 30 and 34 in the United States with a correlation coefficient (R) of 0.073 and weighted average of 6.5%. Similarly, the statistical analysis conducted on geographies consisting of 82,477,252 people shows a mild positive correlation between the proportion of Sierra Leoneans and unemployment rate among population between the ages 30 and 34 in the United States with a correlation coefficient (R) of 0.337 and weighted average of 5.8%, a difference of 12.1%.
Unemployment Among Ages 30 to 34 years Correlation Summary
| Measurement | Immigrants from Trinidad and Tobago | Sierra Leonean |
| Minimum | 0.20% | 1.4% |
| Maximum | 15.9% | 19.2% |
| Range | 15.7% | 17.8% |
| Mean | 7.2% | 6.3% |
| Median | 6.4% | 5.6% |
| Interquartile 25% (IQ1) | 5.3% | 4.9% |
| Interquartile 75% (IQ3) | 9.1% | 7.2% |
| Interquartile Range (IQR) | 3.8% | 2.3% |
| Standard Deviation (Sample) | 3.1% | 3.0% |
| Standard Deviation (Population) | 3.1% | 2.9% |
Similar Demographics by Unemployment Among Ages 30 to 34 years
Demographics Similar to Immigrants from Trinidad and Tobago by Unemployment Among Ages 30 to 34 years
In terms of unemployment among ages 30 to 34 years, the demographic groups most similar to Immigrants from Trinidad and Tobago are Jamaican (6.5%, a difference of 0.29%), Menominee (6.4%, a difference of 0.37%), Senegalese (6.4%, a difference of 0.42%), Immigrants from West Indies (6.4%, a difference of 0.45%), and Central American Indian (6.4%, a difference of 0.48%).
| Demographics | Rating | Rank | Unemployment Among Ages 30 to 34 years |
| Hispanics or Latinos | 0.0 /100 | #283 | Tragic 6.4% |
| Immigrants | Bangladesh | 0.0 /100 | #284 | Tragic 6.4% |
| Choctaw | 0.0 /100 | #285 | Tragic 6.4% |
| Central American Indians | 0.0 /100 | #286 | Tragic 6.4% |
| Immigrants | West Indies | 0.0 /100 | #287 | Tragic 6.4% |
| Senegalese | 0.0 /100 | #288 | Tragic 6.4% |
| Menominee | 0.0 /100 | #289 | Tragic 6.4% |
| Immigrants | Trinidad and Tobago | 0.0 /100 | #290 | Tragic 6.5% |
| Jamaicans | 0.0 /100 | #291 | Tragic 6.5% |
| Vietnamese | 0.0 /100 | #292 | Tragic 6.5% |
| West Indians | 0.0 /100 | #293 | Tragic 6.5% |
| Barbadians | 0.0 /100 | #294 | Tragic 6.5% |
| Trinidadians and Tobagonians | 0.0 /100 | #295 | Tragic 6.5% |
| Immigrants | Jamaica | 0.0 /100 | #296 | Tragic 6.5% |
| Creek | 0.0 /100 | #297 | Tragic 6.6% |
Demographics Similar to Sierra Leoneans by Unemployment Among Ages 30 to 34 years
In terms of unemployment among ages 30 to 34 years, the demographic groups most similar to Sierra Leoneans are Guamanian/Chamorro (5.8%, a difference of 0.020%), French Canadian (5.8%, a difference of 0.21%), Panamanian (5.8%, a difference of 0.24%), Spaniard (5.8%, a difference of 0.34%), and Immigrants from Fiji (5.7%, a difference of 0.45%).
| Demographics | Rating | Rank | Unemployment Among Ages 30 to 34 years |
| Immigrants | Immigrants | 7.1 /100 | #213 | Tragic 5.7% |
| Immigrants | Panama | 5.9 /100 | #214 | Tragic 5.7% |
| Immigrants | Cambodia | 5.8 /100 | #215 | Tragic 5.7% |
| Immigrants | Syria | 5.5 /100 | #216 | Tragic 5.7% |
| Immigrants | Fiji | 5.1 /100 | #217 | Tragic 5.7% |
| Panamanians | 4.5 /100 | #218 | Tragic 5.8% |
| French Canadians | 4.4 /100 | #219 | Tragic 5.8% |
| Sierra Leoneans | 3.9 /100 | #220 | Tragic 5.8% |
| Guamanians/Chamorros | 3.9 /100 | #221 | Tragic 5.8% |
| Spaniards | 3.2 /100 | #222 | Tragic 5.8% |
| Bermudans | 2.7 /100 | #223 | Tragic 5.8% |
| Slovaks | 2.5 /100 | #224 | Tragic 5.8% |
| Samoans | 2.5 /100 | #225 | Tragic 5.8% |
| Liberians | 2.3 /100 | #226 | Tragic 5.8% |
| Spanish | 1.8 /100 | #227 | Tragic 5.8% |