Immigrants from Trinidad and Tobago vs Mexican Unemployment Among Ages 45 to 54 years
COMPARE
Immigrants from Trinidad and Tobago
Mexican
Unemployment Among Ages 45 to 54 years
Unemployment Among Ages 45 to 54 years Comparison
Immigrants from Trinidad and Tobago
Mexicans
5.3%
UNEMPLOYMENT AMONG AGES 45 TO 54 YEARS
0.0/ 100
METRIC RATING
298th/ 347
METRIC RANK
4.9%
UNEMPLOYMENT AMONG AGES 45 TO 54 YEARS
0.1/ 100
METRIC RATING
262nd/ 347
METRIC RANK
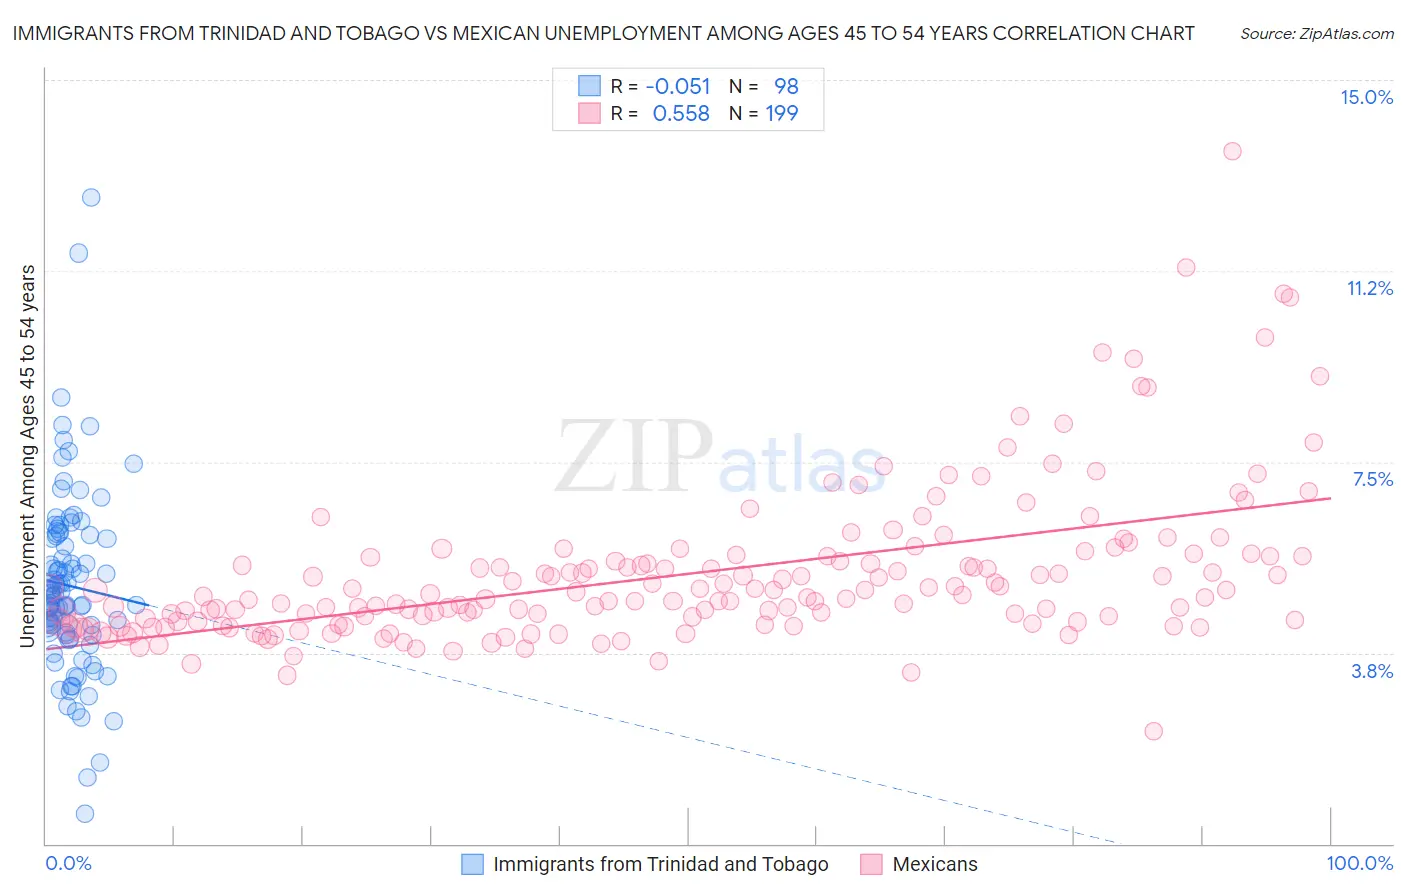
Immigrants from Trinidad and Tobago vs Mexican Unemployment Among Ages 45 to 54 years Correlation Chart
The statistical analysis conducted on geographies consisting of 220,989,097 people shows a slight negative correlation between the proportion of Immigrants from Trinidad and Tobago and unemployment rate among population between the ages 45 and 54 in the United States with a correlation coefficient (R) of -0.051 and weighted average of 5.3%. Similarly, the statistical analysis conducted on geographies consisting of 526,378,412 people shows a substantial positive correlation between the proportion of Mexicans and unemployment rate among population between the ages 45 and 54 in the United States with a correlation coefficient (R) of 0.558 and weighted average of 4.9%, a difference of 8.1%.
Unemployment Among Ages 45 to 54 years Correlation Summary
| Measurement | Immigrants from Trinidad and Tobago | Mexican |
| Minimum | 0.60% | 2.2% |
| Maximum | 12.7% | 13.6% |
| Range | 12.1% | 11.4% |
| Mean | 5.1% | 5.3% |
| Median | 4.9% | 4.9% |
| Interquartile 25% (IQ1) | 4.1% | 4.4% |
| Interquartile 75% (IQ3) | 6.0% | 5.6% |
| Interquartile Range (IQR) | 1.9% | 1.3% |
| Standard Deviation (Sample) | 1.8% | 1.5% |
| Standard Deviation (Population) | 1.8% | 1.5% |
Similar Demographics by Unemployment Among Ages 45 to 54 years
Demographics Similar to Immigrants from Trinidad and Tobago by Unemployment Among Ages 45 to 54 years
In terms of unemployment among ages 45 to 54 years, the demographic groups most similar to Immigrants from Trinidad and Tobago are Ecuadorian (5.3%, a difference of 0.020%), Aleut (5.3%, a difference of 0.12%), West Indian (5.3%, a difference of 0.12%), Central American Indian (5.3%, a difference of 0.23%), and Jamaican (5.3%, a difference of 0.31%).
| Demographics | Rating | Rank | Unemployment Among Ages 45 to 54 years |
| Armenians | 0.0 /100 | #291 | Tragic 5.2% |
| Trinidadians and Tobagonians | 0.0 /100 | #292 | Tragic 5.2% |
| Immigrants | Senegal | 0.0 /100 | #293 | Tragic 5.2% |
| Belizeans | 0.0 /100 | #294 | Tragic 5.2% |
| Jamaicans | 0.0 /100 | #295 | Tragic 5.3% |
| Aleuts | 0.0 /100 | #296 | Tragic 5.3% |
| West Indians | 0.0 /100 | #297 | Tragic 5.3% |
| Immigrants | Trinidad and Tobago | 0.0 /100 | #298 | Tragic 5.3% |
| Ecuadorians | 0.0 /100 | #299 | Tragic 5.3% |
| Central American Indians | 0.0 /100 | #300 | Tragic 5.3% |
| Menominee | 0.0 /100 | #301 | Tragic 5.3% |
| Immigrants | Ecuador | 0.0 /100 | #302 | Tragic 5.3% |
| Immigrants | Belize | 0.0 /100 | #303 | Tragic 5.3% |
| Immigrants | Jamaica | 0.0 /100 | #304 | Tragic 5.4% |
| Immigrants | West Indies | 0.0 /100 | #305 | Tragic 5.4% |
Demographics Similar to Mexicans by Unemployment Among Ages 45 to 54 years
In terms of unemployment among ages 45 to 54 years, the demographic groups most similar to Mexicans are Mexican American Indian (4.9%, a difference of 0.24%), Guatemalan (4.9%, a difference of 0.24%), Ugandan (4.9%, a difference of 0.25%), Subsaharan African (4.9%, a difference of 0.40%), and Immigrants from Fiji (4.9%, a difference of 0.40%).
| Demographics | Rating | Rank | Unemployment Among Ages 45 to 54 years |
| Immigrants | El Salvador | 0.2 /100 | #255 | Tragic 4.8% |
| Immigrants | Western Asia | 0.2 /100 | #256 | Tragic 4.8% |
| Immigrants | Western Africa | 0.2 /100 | #257 | Tragic 4.9% |
| Sub-Saharan Africans | 0.2 /100 | #258 | Tragic 4.9% |
| Ugandans | 0.1 /100 | #259 | Tragic 4.9% |
| Mexican American Indians | 0.1 /100 | #260 | Tragic 4.9% |
| Guatemalans | 0.1 /100 | #261 | Tragic 4.9% |
| Mexicans | 0.1 /100 | #262 | Tragic 4.9% |
| Immigrants | Fiji | 0.1 /100 | #263 | Tragic 4.9% |
| Immigrants | Guatemala | 0.1 /100 | #264 | Tragic 4.9% |
| Immigrants | Somalia | 0.1 /100 | #265 | Tragic 4.9% |
| Ghanaians | 0.0 /100 | #266 | Tragic 4.9% |
| Bahamians | 0.0 /100 | #267 | Tragic 4.9% |
| Immigrants | Uzbekistan | 0.0 /100 | #268 | Tragic 4.9% |
| Somalis | 0.0 /100 | #269 | Tragic 5.0% |