Immigrants from Trinidad and Tobago vs Immigrants from India Female Unemployment
COMPARE
Immigrants from Trinidad and Tobago
Immigrants from India
Female Unemployment
Female Unemployment Comparison
Immigrants from Trinidad and Tobago
Immigrants from India
6.1%
FEMALE UNEMPLOYMENT
0.0/ 100
METRIC RATING
292nd/ 347
METRIC RANK
4.7%
FEMALE UNEMPLOYMENT
99.9/ 100
METRIC RATING
25th/ 347
METRIC RANK
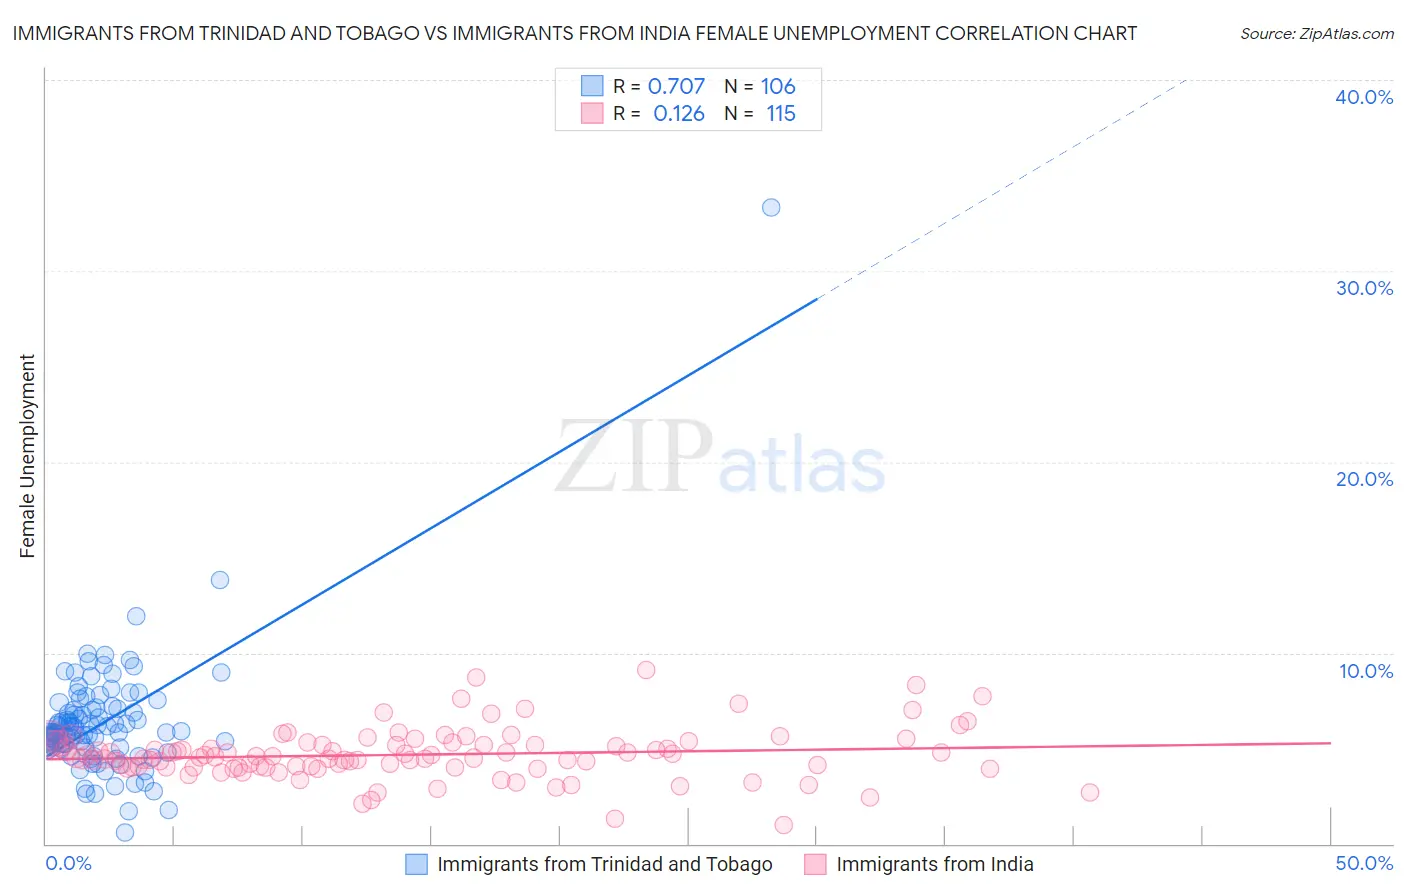
Immigrants from Trinidad and Tobago vs Immigrants from India Female Unemployment Correlation Chart
The statistical analysis conducted on geographies consisting of 223,166,335 people shows a strong positive correlation between the proportion of Immigrants from Trinidad and Tobago and unemploymnet rate among females in the United States with a correlation coefficient (R) of 0.707 and weighted average of 6.1%. Similarly, the statistical analysis conducted on geographies consisting of 431,990,164 people shows a poor positive correlation between the proportion of Immigrants from India and unemploymnet rate among females in the United States with a correlation coefficient (R) of 0.126 and weighted average of 4.7%, a difference of 29.1%.
Female Unemployment Correlation Summary
| Measurement | Immigrants from Trinidad and Tobago | Immigrants from India |
| Minimum | 0.60% | 1.0% |
| Maximum | 33.3% | 9.1% |
| Range | 32.7% | 8.1% |
| Mean | 6.3% | 4.7% |
| Median | 5.8% | 4.5% |
| Interquartile 25% (IQ1) | 5.0% | 4.0% |
| Interquartile 75% (IQ3) | 7.1% | 5.2% |
| Interquartile Range (IQR) | 2.0% | 1.2% |
| Standard Deviation (Sample) | 3.3% | 1.3% |
| Standard Deviation (Population) | 3.3% | 1.3% |
Similar Demographics by Female Unemployment
Demographics Similar to Immigrants from Trinidad and Tobago by Female Unemployment
In terms of female unemployment, the demographic groups most similar to Immigrants from Trinidad and Tobago are Immigrants from West Indies (6.1%, a difference of 0.060%), Mexican (6.1%, a difference of 0.080%), Immigrants from Caribbean (6.1%, a difference of 0.17%), Immigrants from El Salvador (6.1%, a difference of 0.18%), and Trinidadian and Tobagonian (6.1%, a difference of 0.23%).
| Demographics | Rating | Rank | Female Unemployment |
| Immigrants | Cabo Verde | 0.0 /100 | #285 | Tragic 6.1% |
| Chippewa | 0.0 /100 | #286 | Tragic 6.1% |
| Immigrants | Guatemala | 0.0 /100 | #287 | Tragic 6.1% |
| Haitians | 0.0 /100 | #288 | Tragic 6.1% |
| Trinidadians and Tobagonians | 0.0 /100 | #289 | Tragic 6.1% |
| Immigrants | Caribbean | 0.0 /100 | #290 | Tragic 6.1% |
| Immigrants | West Indies | 0.0 /100 | #291 | Tragic 6.1% |
| Immigrants | Trinidad and Tobago | 0.0 /100 | #292 | Tragic 6.1% |
| Mexicans | 0.0 /100 | #293 | Tragic 6.1% |
| Immigrants | El Salvador | 0.0 /100 | #294 | Tragic 6.1% |
| Immigrants | Latin America | 0.0 /100 | #295 | Tragic 6.1% |
| Alaskan Athabascans | 0.0 /100 | #296 | Tragic 6.1% |
| West Indians | 0.0 /100 | #297 | Tragic 6.1% |
| Jamaicans | 0.0 /100 | #298 | Tragic 6.1% |
| Ute | 0.0 /100 | #299 | Tragic 6.1% |
Demographics Similar to Immigrants from India by Female Unemployment
In terms of female unemployment, the demographic groups most similar to Immigrants from India are Immigrants from Bosnia and Herzegovina (4.7%, a difference of 0.040%), Welsh (4.7%, a difference of 0.090%), British (4.7%, a difference of 0.20%), Irish (4.7%, a difference of 0.24%), and Cypriot (4.7%, a difference of 0.24%).
| Demographics | Rating | Rank | Female Unemployment |
| Latvians | 99.9 /100 | #18 | Exceptional 4.7% |
| Poles | 99.9 /100 | #19 | Exceptional 4.7% |
| Bulgarians | 99.9 /100 | #20 | Exceptional 4.7% |
| Fijians | 99.9 /100 | #21 | Exceptional 4.7% |
| Europeans | 99.9 /100 | #22 | Exceptional 4.7% |
| Scottish | 99.9 /100 | #23 | Exceptional 4.7% |
| Welsh | 99.9 /100 | #24 | Exceptional 4.7% |
| Immigrants | India | 99.9 /100 | #25 | Exceptional 4.7% |
| Immigrants | Bosnia and Herzegovina | 99.9 /100 | #26 | Exceptional 4.7% |
| British | 99.9 /100 | #27 | Exceptional 4.7% |
| Irish | 99.9 /100 | #28 | Exceptional 4.7% |
| Cypriots | 99.9 /100 | #29 | Exceptional 4.7% |
| Lithuanians | 99.8 /100 | #30 | Exceptional 4.7% |
| Sudanese | 99.8 /100 | #31 | Exceptional 4.8% |
| Slovaks | 99.8 /100 | #32 | Exceptional 4.8% |