Immigrants from Trinidad and Tobago vs Immigrants from Greece Unemployment Among Seniors over 75 years
COMPARE
Immigrants from Trinidad and Tobago
Immigrants from Greece
Unemployment Among Seniors over 75 years
Unemployment Among Seniors over 75 years Comparison
Immigrants from Trinidad and Tobago
Immigrants from Greece
8.5%
UNEMPLOYMENT AMONG SENIORS OVER 75 YEARS
90.8/ 100
METRIC RATING
136th/ 347
METRIC RANK
8.3%
UNEMPLOYMENT AMONG SENIORS OVER 75 YEARS
97.9/ 100
METRIC RATING
117th/ 347
METRIC RANK
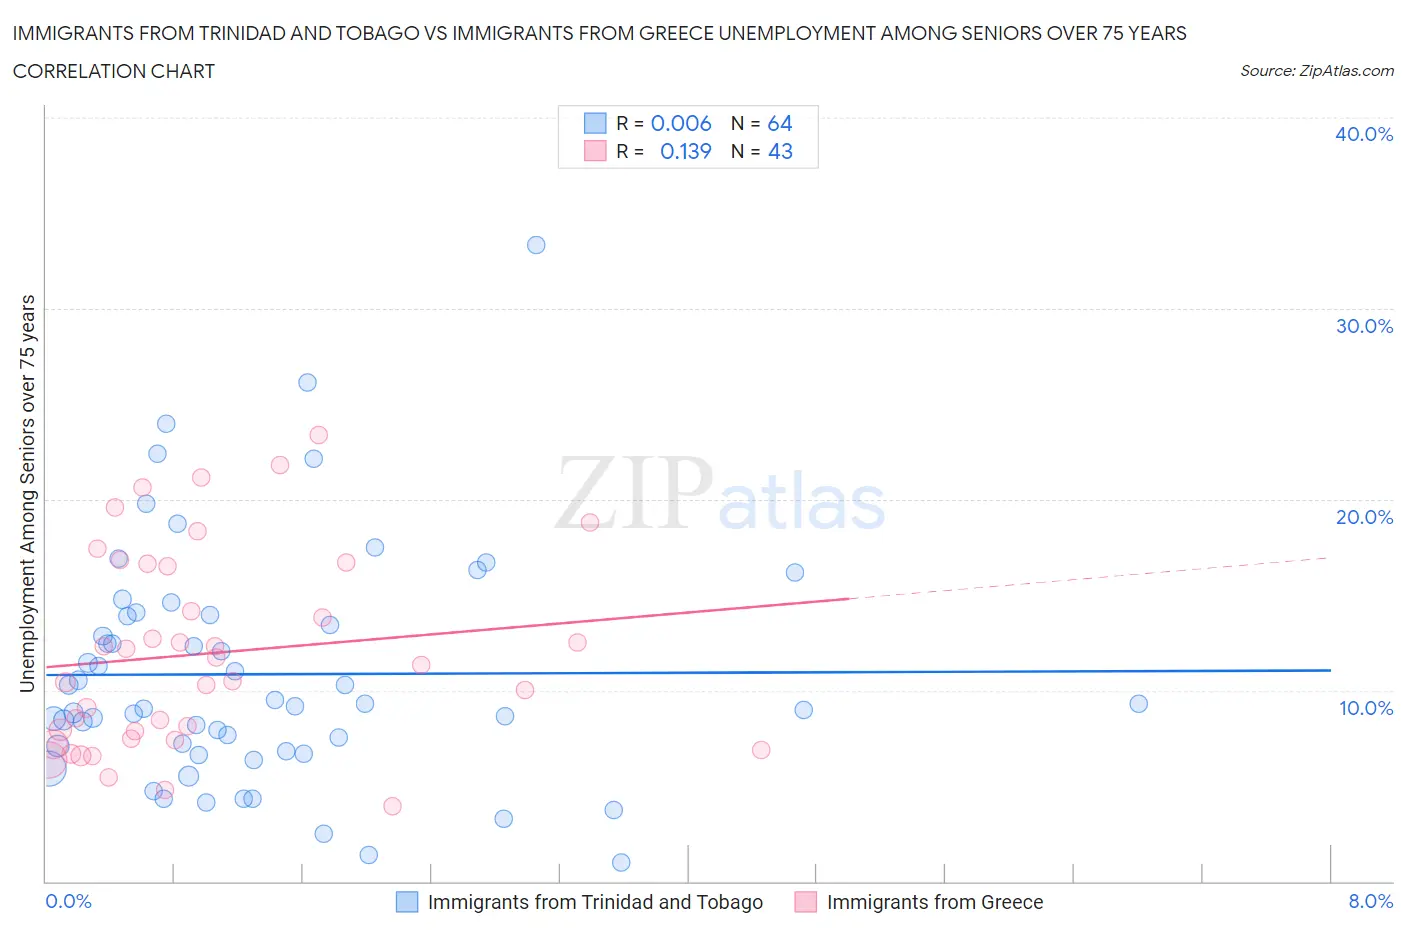
Immigrants from Trinidad and Tobago vs Immigrants from Greece Unemployment Among Seniors over 75 years Correlation Chart
The statistical analysis conducted on geographies consisting of 139,199,309 people shows no correlation between the proportion of Immigrants from Trinidad and Tobago and unemployment rate among seniors over the age of 75 in the United States with a correlation coefficient (R) of 0.006 and weighted average of 8.5%. Similarly, the statistical analysis conducted on geographies consisting of 137,675,631 people shows a poor positive correlation between the proportion of Immigrants from Greece and unemployment rate among seniors over the age of 75 in the United States with a correlation coefficient (R) of 0.139 and weighted average of 8.3%, a difference of 2.2%.
Unemployment Among Seniors over 75 years Correlation Summary
| Measurement | Immigrants from Trinidad and Tobago | Immigrants from Greece |
| Minimum | 1.0% | 3.9% |
| Maximum | 33.3% | 23.4% |
| Range | 32.3% | 19.5% |
| Mean | 10.8% | 11.9% |
| Median | 9.2% | 11.3% |
| Interquartile 25% (IQ1) | 7.0% | 7.5% |
| Interquartile 75% (IQ3) | 13.9% | 16.6% |
| Interquartile Range (IQR) | 7.0% | 9.2% |
| Standard Deviation (Sample) | 6.1% | 5.2% |
| Standard Deviation (Population) | 6.1% | 5.1% |
Demographics Similar to Immigrants from Trinidad and Tobago and Immigrants from Greece by Unemployment Among Seniors over 75 years
In terms of unemployment among seniors over 75 years, the demographic groups most similar to Immigrants from Trinidad and Tobago are Haitian (8.5%, a difference of 0.11%), Immigrants from Czechoslovakia (8.4%, a difference of 0.50%), Serbian (8.4%, a difference of 0.58%), Chilean (8.4%, a difference of 0.61%), and German Russian (8.4%, a difference of 0.90%). Similarly, the demographic groups most similar to Immigrants from Greece are Immigrants from Middle Africa (8.3%, a difference of 0.040%), Immigrants from West Indies (8.3%, a difference of 0.14%), Japanese (8.3%, a difference of 0.31%), Immigrants from Asia (8.3%, a difference of 0.33%), and Immigrants from Croatia (8.3%, a difference of 0.45%).
| Demographics | Rating | Rank | Unemployment Among Seniors over 75 years |
| Immigrants | West Indies | 98.1 /100 | #116 | Exceptional 8.3% |
| Immigrants | Greece | 97.9 /100 | #117 | Exceptional 8.3% |
| Immigrants | Middle Africa | 97.9 /100 | #118 | Exceptional 8.3% |
| Japanese | 97.5 /100 | #119 | Exceptional 8.3% |
| Immigrants | Asia | 97.4 /100 | #120 | Exceptional 8.3% |
| Immigrants | Croatia | 97.2 /100 | #121 | Exceptional 8.3% |
| Immigrants | Russia | 97.1 /100 | #122 | Exceptional 8.3% |
| Immigrants | Nepal | 96.9 /100 | #123 | Exceptional 8.3% |
| Thais | 96.8 /100 | #124 | Exceptional 8.3% |
| Immigrants | Moldova | 96.7 /100 | #125 | Exceptional 8.3% |
| Belizeans | 96.3 /100 | #126 | Exceptional 8.4% |
| Hondurans | 96.2 /100 | #127 | Exceptional 8.4% |
| Native Hawaiians | 96.1 /100 | #128 | Exceptional 8.4% |
| Ghanaians | 96.0 /100 | #129 | Exceptional 8.4% |
| Apache | 95.2 /100 | #130 | Exceptional 8.4% |
| German Russians | 94.9 /100 | #131 | Exceptional 8.4% |
| Chileans | 93.8 /100 | #132 | Exceptional 8.4% |
| Serbians | 93.7 /100 | #133 | Exceptional 8.4% |
| Immigrants | Czechoslovakia | 93.4 /100 | #134 | Exceptional 8.4% |
| Haitians | 91.4 /100 | #135 | Exceptional 8.5% |
| Immigrants | Trinidad and Tobago | 90.8 /100 | #136 | Exceptional 8.5% |