Immigrants from Trinidad and Tobago vs French Canadian Unemployment Among Women with Children Under 18 years
COMPARE
Immigrants from Trinidad and Tobago
French Canadian
Unemployment Among Women with Children Under 18 years
Unemployment Among Women with Children Under 18 years Comparison
Immigrants from Trinidad and Tobago
French Canadians
6.1%
UNEMPLOYMENT AMONG WOMEN WITH CHILDREN UNDER 18 YEARS
0.1/ 100
METRIC RATING
262nd/ 347
METRIC RANK
5.2%
UNEMPLOYMENT AMONG WOMEN WITH CHILDREN UNDER 18 YEARS
88.9/ 100
METRIC RATING
111th/ 347
METRIC RANK
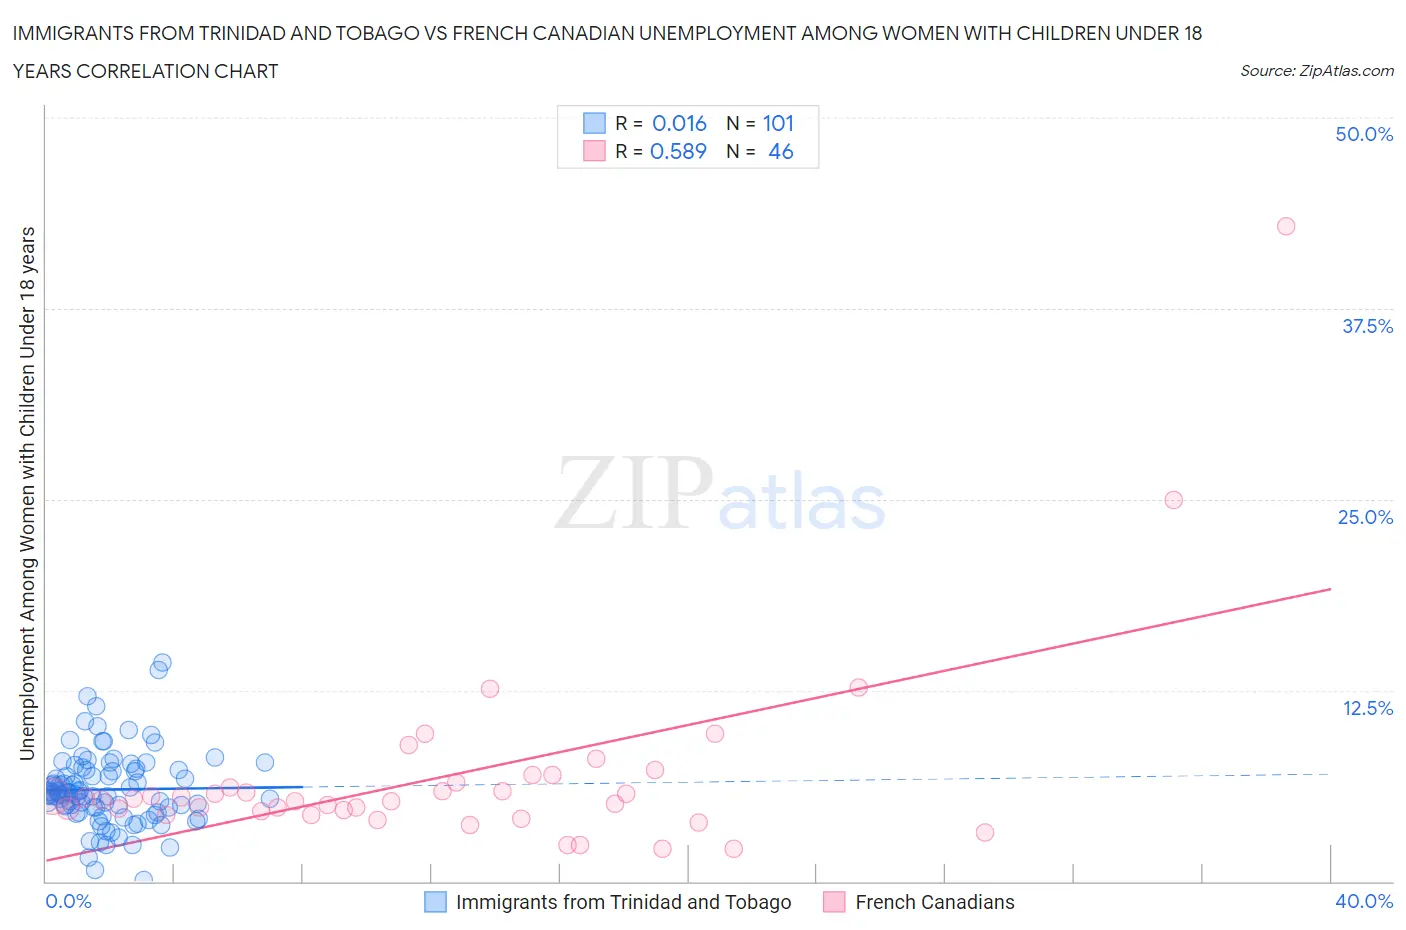
Immigrants from Trinidad and Tobago vs French Canadian Unemployment Among Women with Children Under 18 years Correlation Chart
The statistical analysis conducted on geographies consisting of 219,495,457 people shows no correlation between the proportion of Immigrants from Trinidad and Tobago and unemployment rate among women with children under the age of 18 in the United States with a correlation coefficient (R) of 0.016 and weighted average of 6.1%. Similarly, the statistical analysis conducted on geographies consisting of 465,765,550 people shows a substantial positive correlation between the proportion of French Canadians and unemployment rate among women with children under the age of 18 in the United States with a correlation coefficient (R) of 0.589 and weighted average of 5.2%, a difference of 17.0%.
Unemployment Among Women with Children Under 18 years Correlation Summary
| Measurement | Immigrants from Trinidad and Tobago | French Canadian |
| Minimum | 0.10% | 2.1% |
| Maximum | 14.3% | 42.9% |
| Range | 14.2% | 40.8% |
| Mean | 6.0% | 6.9% |
| Median | 5.7% | 5.4% |
| Interquartile 25% (IQ1) | 4.7% | 4.6% |
| Interquartile 75% (IQ3) | 7.3% | 6.5% |
| Interquartile Range (IQR) | 2.6% | 1.9% |
| Standard Deviation (Sample) | 2.4% | 6.5% |
| Standard Deviation (Population) | 2.4% | 6.5% |
Similar Demographics by Unemployment Among Women with Children Under 18 years
Demographics Similar to Immigrants from Trinidad and Tobago by Unemployment Among Women with Children Under 18 years
In terms of unemployment among women with children under 18 years, the demographic groups most similar to Immigrants from Trinidad and Tobago are Immigrants from Liberia (6.1%, a difference of 0.0%), Spanish American Indian (6.1%, a difference of 0.020%), Comanche (6.1%, a difference of 0.090%), Nigerian (6.1%, a difference of 0.10%), and Ottawa (6.1%, a difference of 0.12%).
| Demographics | Rating | Rank | Unemployment Among Women with Children Under 18 years |
| Liberians | 0.2 /100 | #255 | Tragic 6.0% |
| Nepalese | 0.2 /100 | #256 | Tragic 6.0% |
| Bermudans | 0.1 /100 | #257 | Tragic 6.1% |
| Immigrants | Nigeria | 0.1 /100 | #258 | Tragic 6.1% |
| Ottawa | 0.1 /100 | #259 | Tragic 6.1% |
| Nigerians | 0.1 /100 | #260 | Tragic 6.1% |
| Immigrants | Liberia | 0.1 /100 | #261 | Tragic 6.1% |
| Immigrants | Trinidad and Tobago | 0.1 /100 | #262 | Tragic 6.1% |
| Spanish American Indians | 0.1 /100 | #263 | Tragic 6.1% |
| Comanche | 0.1 /100 | #264 | Tragic 6.1% |
| Immigrants | Bahamas | 0.1 /100 | #265 | Tragic 6.1% |
| Sub-Saharan Africans | 0.1 /100 | #266 | Tragic 6.2% |
| French American Indians | 0.1 /100 | #267 | Tragic 6.2% |
| Trinidadians and Tobagonians | 0.1 /100 | #268 | Tragic 6.2% |
| Cajuns | 0.1 /100 | #269 | Tragic 6.2% |
Demographics Similar to French Canadians by Unemployment Among Women with Children Under 18 years
In terms of unemployment among women with children under 18 years, the demographic groups most similar to French Canadians are Immigrants from Czechoslovakia (5.2%, a difference of 0.0%), Immigrants from Russia (5.2%, a difference of 0.020%), Immigrants from Eastern Europe (5.2%, a difference of 0.070%), French (5.2%, a difference of 0.090%), and Kenyan (5.3%, a difference of 0.13%).
| Demographics | Rating | Rank | Unemployment Among Women with Children Under 18 years |
| Immigrants | Switzerland | 90.1 /100 | #104 | Exceptional 5.2% |
| Immigrants | France | 90.0 /100 | #105 | Excellent 5.2% |
| Pakistanis | 89.9 /100 | #106 | Excellent 5.2% |
| Slavs | 89.8 /100 | #107 | Excellent 5.2% |
| Iranians | 89.7 /100 | #108 | Excellent 5.2% |
| Immigrants | Russia | 89.0 /100 | #109 | Excellent 5.2% |
| Immigrants | Czechoslovakia | 88.9 /100 | #110 | Excellent 5.2% |
| French Canadians | 88.9 /100 | #111 | Excellent 5.2% |
| Immigrants | Eastern Europe | 88.5 /100 | #112 | Excellent 5.2% |
| French | 88.4 /100 | #113 | Excellent 5.2% |
| Kenyans | 88.2 /100 | #114 | Excellent 5.3% |
| Hungarians | 88.1 /100 | #115 | Excellent 5.3% |
| Macedonians | 87.7 /100 | #116 | Excellent 5.3% |
| Canadians | 87.4 /100 | #117 | Excellent 5.3% |
| Immigrants | Europe | 86.7 /100 | #118 | Excellent 5.3% |