Immigrants from Thailand vs Bermudan Unemployment Among Ages 45 to 54 years
COMPARE
Immigrants from Thailand
Bermudan
Unemployment Among Ages 45 to 54 years
Unemployment Among Ages 45 to 54 years Comparison
Immigrants from Thailand
Bermudans
4.6%
UNEMPLOYMENT AMONG AGES 45 TO 54 YEARS
34.1/ 100
METRIC RATING
192nd/ 347
METRIC RANK
5.0%
UNEMPLOYMENT AMONG AGES 45 TO 54 YEARS
0.0/ 100
METRIC RATING
275th/ 347
METRIC RANK
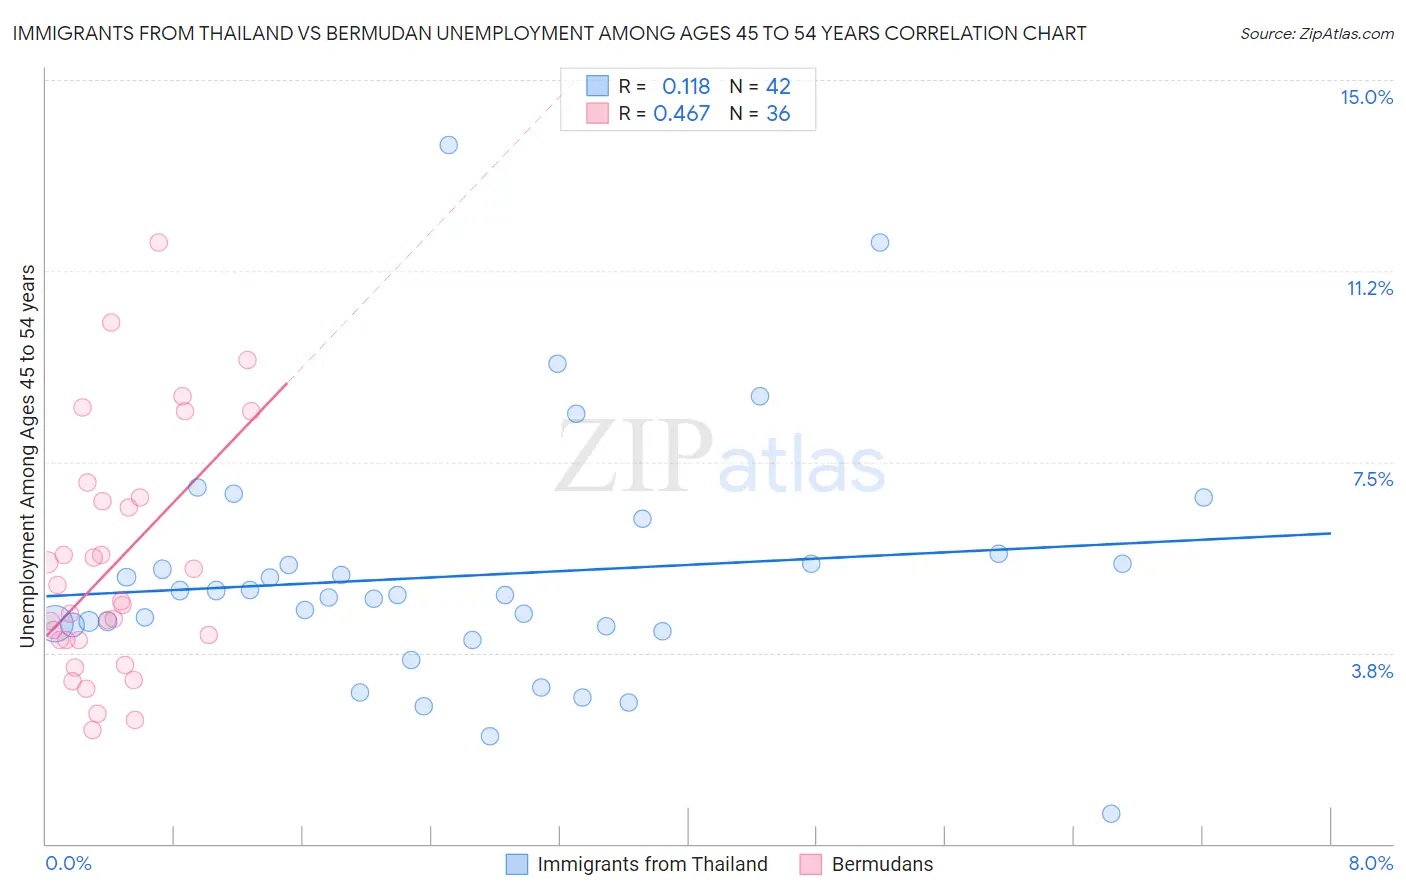
Immigrants from Thailand vs Bermudan Unemployment Among Ages 45 to 54 years Correlation Chart
The statistical analysis conducted on geographies consisting of 311,946,121 people shows a poor positive correlation between the proportion of Immigrants from Thailand and unemployment rate among population between the ages 45 and 54 in the United States with a correlation coefficient (R) of 0.118 and weighted average of 4.6%. Similarly, the statistical analysis conducted on geographies consisting of 55,375,201 people shows a moderate positive correlation between the proportion of Bermudans and unemployment rate among population between the ages 45 and 54 in the United States with a correlation coefficient (R) of 0.467 and weighted average of 5.0%, a difference of 9.5%.
Unemployment Among Ages 45 to 54 years Correlation Summary
| Measurement | Immigrants from Thailand | Bermudan |
| Minimum | 0.60% | 2.2% |
| Maximum | 13.7% | 11.8% |
| Range | 13.1% | 9.6% |
| Mean | 5.3% | 5.5% |
| Median | 4.9% | 4.7% |
| Interquartile 25% (IQ1) | 4.3% | 4.0% |
| Interquartile 75% (IQ3) | 5.5% | 6.8% |
| Interquartile Range (IQR) | 1.2% | 2.8% |
| Standard Deviation (Sample) | 2.4% | 2.4% |
| Standard Deviation (Population) | 2.4% | 2.3% |
Similar Demographics by Unemployment Among Ages 45 to 54 years
Demographics Similar to Immigrants from Thailand by Unemployment Among Ages 45 to 54 years
In terms of unemployment among ages 45 to 54 years, the demographic groups most similar to Immigrants from Thailand are Immigrants from Uruguay (4.6%, a difference of 0.020%), Immigrants from Serbia (4.6%, a difference of 0.040%), Immigrants from Lithuania (4.6%, a difference of 0.040%), South American (4.6%, a difference of 0.060%), and Immigrants from Laos (4.6%, a difference of 0.080%).
| Demographics | Rating | Rank | Unemployment Among Ages 45 to 54 years |
| Immigrants | Philippines | 41.0 /100 | #185 | Average 4.5% |
| Hawaiians | 39.1 /100 | #186 | Fair 4.5% |
| Immigrants | Ukraine | 36.8 /100 | #187 | Fair 4.5% |
| Immigrants | Sierra Leone | 36.3 /100 | #188 | Fair 4.6% |
| Immigrants | Laos | 35.7 /100 | #189 | Fair 4.6% |
| Immigrants | Serbia | 34.8 /100 | #190 | Fair 4.6% |
| Immigrants | Uruguay | 34.4 /100 | #191 | Fair 4.6% |
| Immigrants | Thailand | 34.1 /100 | #192 | Fair 4.6% |
| Immigrants | Lithuania | 33.2 /100 | #193 | Fair 4.6% |
| South Americans | 32.9 /100 | #194 | Fair 4.6% |
| Peruvians | 31.5 /100 | #195 | Fair 4.6% |
| Estonians | 31.2 /100 | #196 | Fair 4.6% |
| Albanians | 31.1 /100 | #197 | Fair 4.6% |
| Immigrants | Belarus | 30.6 /100 | #198 | Fair 4.6% |
| Brazilians | 20.1 /100 | #199 | Fair 4.6% |
Demographics Similar to Bermudans by Unemployment Among Ages 45 to 54 years
In terms of unemployment among ages 45 to 54 years, the demographic groups most similar to Bermudans are U.S. Virgin Islander (5.0%, a difference of 0.050%), Immigrants from Latin America (5.0%, a difference of 0.10%), Immigrants from Central America (5.0%, a difference of 0.27%), Cajun (5.0%, a difference of 0.44%), and Immigrants from Ghana (5.0%, a difference of 0.51%).
| Demographics | Rating | Rank | Unemployment Among Ages 45 to 54 years |
| Immigrants | Uzbekistan | 0.0 /100 | #268 | Tragic 4.9% |
| Somalis | 0.0 /100 | #269 | Tragic 5.0% |
| Immigrants | Ghana | 0.0 /100 | #270 | Tragic 5.0% |
| Cajuns | 0.0 /100 | #271 | Tragic 5.0% |
| Immigrants | Central America | 0.0 /100 | #272 | Tragic 5.0% |
| Immigrants | Latin America | 0.0 /100 | #273 | Tragic 5.0% |
| U.S. Virgin Islanders | 0.0 /100 | #274 | Tragic 5.0% |
| Bermudans | 0.0 /100 | #275 | Tragic 5.0% |
| French American Indians | 0.0 /100 | #276 | Tragic 5.0% |
| Immigrants | Mexico | 0.0 /100 | #277 | Tragic 5.0% |
| Dutch West Indians | 0.0 /100 | #278 | Tragic 5.0% |
| Nepalese | 0.0 /100 | #279 | Tragic 5.0% |
| Blackfeet | 0.0 /100 | #280 | Tragic 5.1% |
| Spanish American Indians | 0.0 /100 | #281 | Tragic 5.1% |
| Africans | 0.0 /100 | #282 | Tragic 5.1% |