Immigrants from Taiwan vs Italian Unemployment Among Ages 65 to 74 years
COMPARE
Immigrants from Taiwan
Italian
Unemployment Among Ages 65 to 74 years
Unemployment Among Ages 65 to 74 years Comparison
Immigrants from Taiwan
Italians
5.1%
UNEMPLOYMENT AMONG AGES 65 TO 74 YEARS
99.4/ 100
METRIC RATING
61st/ 347
METRIC RANK
5.5%
UNEMPLOYMENT AMONG AGES 65 TO 74 YEARS
7.7/ 100
METRIC RATING
213th/ 347
METRIC RANK
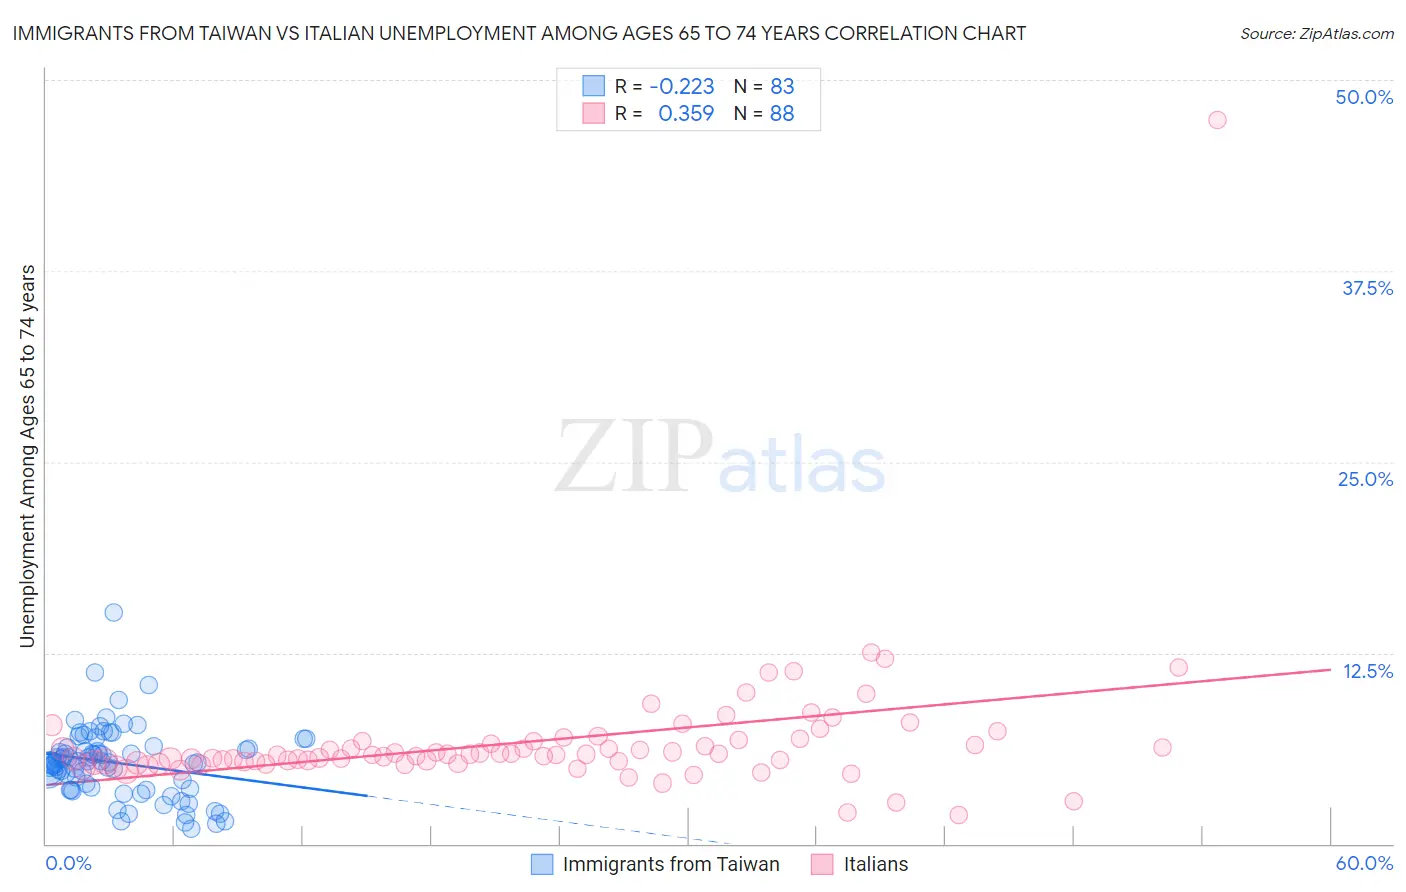
Immigrants from Taiwan vs Italian Unemployment Among Ages 65 to 74 years Correlation Chart
The statistical analysis conducted on geographies consisting of 273,940,566 people shows a weak negative correlation between the proportion of Immigrants from Taiwan and unemployment rate among population between the ages 65 and 74 in the United States with a correlation coefficient (R) of -0.223 and weighted average of 5.1%. Similarly, the statistical analysis conducted on geographies consisting of 447,314,693 people shows a mild positive correlation between the proportion of Italians and unemployment rate among population between the ages 65 and 74 in the United States with a correlation coefficient (R) of 0.359 and weighted average of 5.5%, a difference of 6.6%.
Unemployment Among Ages 65 to 74 years Correlation Summary
| Measurement | Immigrants from Taiwan | Italian |
| Minimum | 1.0% | 1.9% |
| Maximum | 15.1% | 47.4% |
| Range | 14.1% | 45.5% |
| Mean | 5.3% | 6.7% |
| Median | 5.3% | 5.8% |
| Interquartile 25% (IQ1) | 3.6% | 5.3% |
| Interquartile 75% (IQ3) | 6.3% | 6.7% |
| Interquartile Range (IQR) | 2.7% | 1.4% |
| Standard Deviation (Sample) | 2.3% | 4.8% |
| Standard Deviation (Population) | 2.3% | 4.8% |
Similar Demographics by Unemployment Among Ages 65 to 74 years
Demographics Similar to Immigrants from Taiwan by Unemployment Among Ages 65 to 74 years
In terms of unemployment among ages 65 to 74 years, the demographic groups most similar to Immigrants from Taiwan are Nicaraguan (5.1%, a difference of 0.010%), Kiowa (5.1%, a difference of 0.050%), Immigrants from Jordan (5.1%, a difference of 0.070%), Immigrants from Moldova (5.1%, a difference of 0.10%), and Bolivian (5.1%, a difference of 0.11%).
| Demographics | Rating | Rank | Unemployment Among Ages 65 to 74 years |
| Immigrants | Nicaragua | 99.6 /100 | #54 | Exceptional 5.1% |
| Carpatho Rusyns | 99.6 /100 | #55 | Exceptional 5.1% |
| Swedes | 99.5 /100 | #56 | Exceptional 5.1% |
| Croatians | 99.5 /100 | #57 | Exceptional 5.1% |
| Germans | 99.5 /100 | #58 | Exceptional 5.1% |
| Immigrants | Bulgaria | 99.4 /100 | #59 | Exceptional 5.1% |
| Immigrants | Jordan | 99.4 /100 | #60 | Exceptional 5.1% |
| Immigrants | Taiwan | 99.4 /100 | #61 | Exceptional 5.1% |
| Nicaraguans | 99.4 /100 | #62 | Exceptional 5.1% |
| Kiowa | 99.3 /100 | #63 | Exceptional 5.1% |
| Immigrants | Moldova | 99.3 /100 | #64 | Exceptional 5.1% |
| Bolivians | 99.3 /100 | #65 | Exceptional 5.1% |
| Iroquois | 99.3 /100 | #66 | Exceptional 5.1% |
| Swiss | 99.2 /100 | #67 | Exceptional 5.1% |
| Latvians | 99.2 /100 | #68 | Exceptional 5.1% |
Demographics Similar to Italians by Unemployment Among Ages 65 to 74 years
In terms of unemployment among ages 65 to 74 years, the demographic groups most similar to Italians are Haitian (5.5%, a difference of 0.010%), Egyptian (5.5%, a difference of 0.010%), American (5.5%, a difference of 0.050%), Immigrants from Croatia (5.5%, a difference of 0.15%), and Uruguayan (5.5%, a difference of 0.18%).
| Demographics | Rating | Rank | Unemployment Among Ages 65 to 74 years |
| Africans | 12.8 /100 | #206 | Poor 5.5% |
| Immigrants | Uzbekistan | 12.5 /100 | #207 | Poor 5.5% |
| Dutch West Indians | 11.5 /100 | #208 | Poor 5.5% |
| Immigrants | Honduras | 10.4 /100 | #209 | Poor 5.5% |
| Immigrants | Northern Africa | 10.1 /100 | #210 | Poor 5.5% |
| Immigrants | Croatia | 9.1 /100 | #211 | Tragic 5.5% |
| Haitians | 7.7 /100 | #212 | Tragic 5.5% |
| Italians | 7.7 /100 | #213 | Tragic 5.5% |
| Egyptians | 7.6 /100 | #214 | Tragic 5.5% |
| Americans | 7.3 /100 | #215 | Tragic 5.5% |
| Uruguayans | 6.2 /100 | #216 | Tragic 5.5% |
| Blackfeet | 5.8 /100 | #217 | Tragic 5.5% |
| Samoans | 5.7 /100 | #218 | Tragic 5.5% |
| Alsatians | 5.6 /100 | #219 | Tragic 5.5% |
| Immigrants | Syria | 5.1 /100 | #220 | Tragic 5.5% |