Immigrants from Taiwan vs Immigrants from Syria Unemployment Among Seniors over 65 years
COMPARE
Immigrants from Taiwan
Immigrants from Syria
Unemployment Among Seniors over 65 years
Unemployment Among Seniors over 65 years Comparison
Immigrants from Taiwan
Immigrants from Syria
5.0%
UNEMPLOYMENT AMONG SENIORS OVER 65 YEARS
98.2/ 100
METRIC RATING
86th/ 347
METRIC RANK
5.3%
UNEMPLOYMENT AMONG SENIORS OVER 65 YEARS
5.6/ 100
METRIC RATING
224th/ 347
METRIC RANK
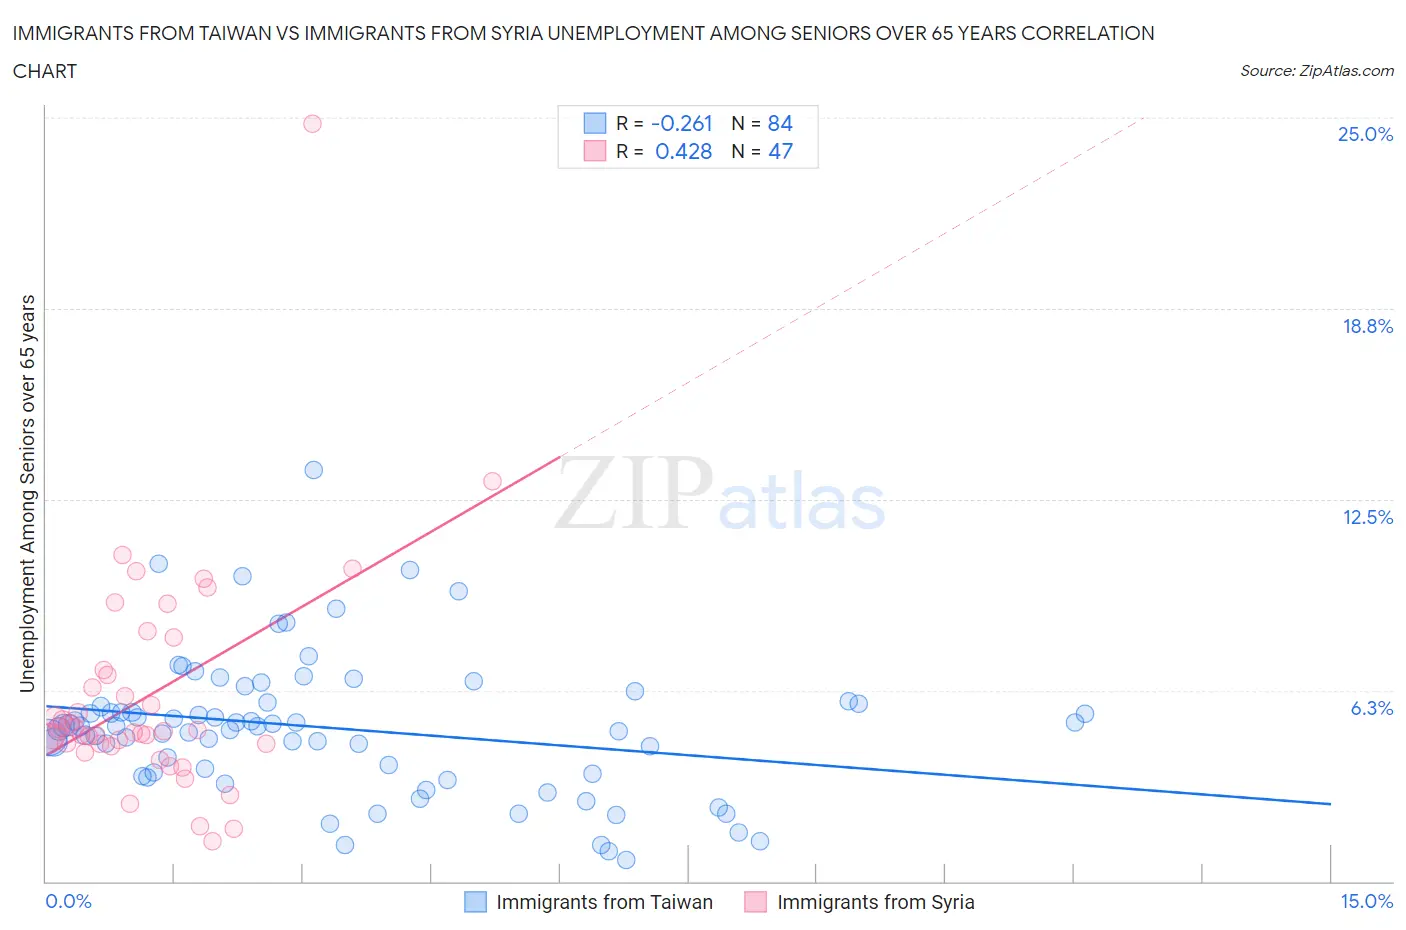
Immigrants from Taiwan vs Immigrants from Syria Unemployment Among Seniors over 65 years Correlation Chart
The statistical analysis conducted on geographies consisting of 278,784,395 people shows a weak negative correlation between the proportion of Immigrants from Taiwan and unemployment rate amomg seniors over the age of 65 in the United States with a correlation coefficient (R) of -0.261 and weighted average of 5.0%. Similarly, the statistical analysis conducted on geographies consisting of 167,873,990 people shows a moderate positive correlation between the proportion of Immigrants from Syria and unemployment rate amomg seniors over the age of 65 in the United States with a correlation coefficient (R) of 0.428 and weighted average of 5.3%, a difference of 5.6%.
Unemployment Among Seniors over 65 years Correlation Summary
| Measurement | Immigrants from Taiwan | Immigrants from Syria |
| Minimum | 0.70% | 1.3% |
| Maximum | 13.4% | 24.8% |
| Range | 12.7% | 23.5% |
| Mean | 5.0% | 6.1% |
| Median | 5.1% | 4.9% |
| Interquartile 25% (IQ1) | 3.5% | 4.5% |
| Interquartile 75% (IQ3) | 5.8% | 6.9% |
| Interquartile Range (IQR) | 2.3% | 2.4% |
| Standard Deviation (Sample) | 2.3% | 3.8% |
| Standard Deviation (Population) | 2.3% | 3.7% |
Similar Demographics by Unemployment Among Seniors over 65 years
Demographics Similar to Immigrants from Taiwan by Unemployment Among Seniors over 65 years
In terms of unemployment among seniors over 65 years, the demographic groups most similar to Immigrants from Taiwan are Immigrants from Hungary (5.0%, a difference of 0.0%), Immigrants from Switzerland (5.0%, a difference of 0.010%), Filipino (5.0%, a difference of 0.060%), Immigrants from Zimbabwe (5.0%, a difference of 0.070%), and Serbian (5.0%, a difference of 0.11%).
| Demographics | Rating | Rank | Unemployment Among Seniors over 65 years |
| Immigrants | Netherlands | 98.8 /100 | #79 | Exceptional 5.0% |
| Immigrants | Ethiopia | 98.6 /100 | #80 | Exceptional 5.0% |
| Estonians | 98.5 /100 | #81 | Exceptional 5.0% |
| Serbians | 98.4 /100 | #82 | Exceptional 5.0% |
| Immigrants | Zimbabwe | 98.3 /100 | #83 | Exceptional 5.0% |
| Filipinos | 98.3 /100 | #84 | Exceptional 5.0% |
| Immigrants | Hungary | 98.2 /100 | #85 | Exceptional 5.0% |
| Immigrants | Taiwan | 98.2 /100 | #86 | Exceptional 5.0% |
| Immigrants | Switzerland | 98.2 /100 | #87 | Exceptional 5.0% |
| Afghans | 97.6 /100 | #88 | Exceptional 5.0% |
| Immigrants | South Central Asia | 97.6 /100 | #89 | Exceptional 5.0% |
| Immigrants | South Africa | 97.6 /100 | #90 | Exceptional 5.0% |
| Immigrants | Bolivia | 97.3 /100 | #91 | Exceptional 5.0% |
| Immigrants | Bulgaria | 97.3 /100 | #92 | Exceptional 5.0% |
| Austrians | 97.3 /100 | #93 | Exceptional 5.0% |
Demographics Similar to Immigrants from Syria by Unemployment Among Seniors over 65 years
In terms of unemployment among seniors over 65 years, the demographic groups most similar to Immigrants from Syria are Honduran (5.3%, a difference of 0.010%), Cree (5.3%, a difference of 0.020%), Immigrants from Croatia (5.3%, a difference of 0.050%), French American Indian (5.3%, a difference of 0.060%), and Israeli (5.3%, a difference of 0.080%).
| Demographics | Rating | Rank | Unemployment Among Seniors over 65 years |
| Italians | 8.3 /100 | #217 | Tragic 5.2% |
| Spaniards | 7.4 /100 | #218 | Tragic 5.2% |
| Dutch West Indians | 6.9 /100 | #219 | Tragic 5.3% |
| Egyptians | 6.4 /100 | #220 | Tragic 5.3% |
| Arapaho | 6.3 /100 | #221 | Tragic 5.3% |
| Israelis | 6.2 /100 | #222 | Tragic 5.3% |
| Cree | 5.8 /100 | #223 | Tragic 5.3% |
| Immigrants | Syria | 5.6 /100 | #224 | Tragic 5.3% |
| Hondurans | 5.6 /100 | #225 | Tragic 5.3% |
| Immigrants | Croatia | 5.3 /100 | #226 | Tragic 5.3% |
| French American Indians | 5.2 /100 | #227 | Tragic 5.3% |
| Haitians | 4.4 /100 | #228 | Tragic 5.3% |
| Samoans | 4.2 /100 | #229 | Tragic 5.3% |
| Immigrants | Argentina | 4.0 /100 | #230 | Tragic 5.3% |
| Hungarians | 3.9 /100 | #231 | Tragic 5.3% |