Immigrants from Syria vs Yakama Unemployment Among Seniors over 75 years
COMPARE
Immigrants from Syria
Yakama
Unemployment Among Seniors over 75 years
Unemployment Among Seniors over 75 years Comparison
Immigrants from Syria
Yakama
8.0%
UNEMPLOYMENT AMONG SENIORS OVER 75 YEARS
99.9/ 100
METRIC RATING
67th/ 347
METRIC RANK
18.4%
UNEMPLOYMENT AMONG SENIORS OVER 75 YEARS
0.0/ 100
METRIC RATING
345th/ 347
METRIC RANK
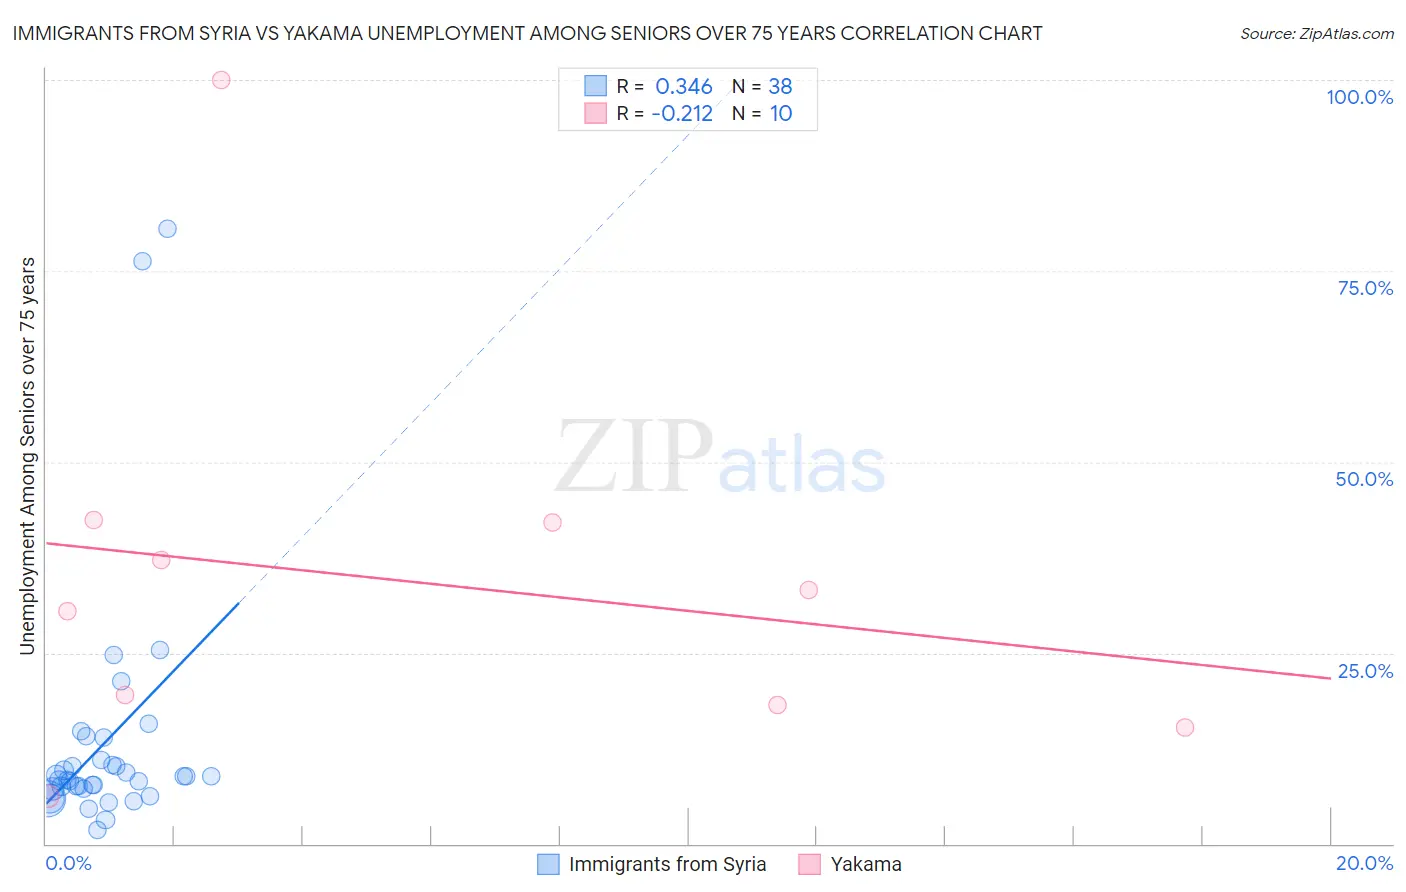
Immigrants from Syria vs Yakama Unemployment Among Seniors over 75 years Correlation Chart
The statistical analysis conducted on geographies consisting of 119,992,649 people shows a mild positive correlation between the proportion of Immigrants from Syria and unemployment rate among seniors over the age of 75 in the United States with a correlation coefficient (R) of 0.346 and weighted average of 8.0%. Similarly, the statistical analysis conducted on geographies consisting of 13,815,439 people shows a weak negative correlation between the proportion of Yakama and unemployment rate among seniors over the age of 75 in the United States with a correlation coefficient (R) of -0.212 and weighted average of 18.4%, a difference of 131.4%.
Unemployment Among Seniors over 75 years Correlation Summary
| Measurement | Immigrants from Syria | Yakama |
| Minimum | 1.8% | 6.2% |
| Maximum | 80.6% | 100.0% |
| Range | 78.8% | 93.8% |
| Mean | 13.3% | 34.4% |
| Median | 8.7% | 31.8% |
| Interquartile 25% (IQ1) | 7.2% | 18.2% |
| Interquartile 75% (IQ3) | 10.9% | 42.0% |
| Interquartile Range (IQR) | 3.7% | 23.8% |
| Standard Deviation (Sample) | 16.4% | 26.0% |
| Standard Deviation (Population) | 16.2% | 24.7% |
Similar Demographics by Unemployment Among Seniors over 75 years
Demographics Similar to Immigrants from Syria by Unemployment Among Seniors over 75 years
In terms of unemployment among seniors over 75 years, the demographic groups most similar to Immigrants from Syria are Immigrants from Austria (8.0%, a difference of 0.040%), Immigrants from South Africa (8.0%, a difference of 0.090%), Indian (Asian) (8.0%, a difference of 0.10%), Immigrants from Argentina (8.0%, a difference of 0.18%), and Argentinean (7.9%, a difference of 0.23%).
| Demographics | Rating | Rank | Unemployment Among Seniors over 75 years |
| Immigrants | Morocco | 99.9 /100 | #60 | Exceptional 7.9% |
| Uruguayans | 99.9 /100 | #61 | Exceptional 7.9% |
| Immigrants | Albania | 99.9 /100 | #62 | Exceptional 7.9% |
| Immigrants | Nicaragua | 99.9 /100 | #63 | Exceptional 7.9% |
| Immigrants | Taiwan | 99.9 /100 | #64 | Exceptional 7.9% |
| Argentineans | 99.9 /100 | #65 | Exceptional 7.9% |
| Immigrants | Austria | 99.9 /100 | #66 | Exceptional 8.0% |
| Immigrants | Syria | 99.9 /100 | #67 | Exceptional 8.0% |
| Immigrants | South Africa | 99.9 /100 | #68 | Exceptional 8.0% |
| Indians (Asian) | 99.9 /100 | #69 | Exceptional 8.0% |
| Immigrants | Argentina | 99.9 /100 | #70 | Exceptional 8.0% |
| Immigrants | Cambodia | 99.9 /100 | #71 | Exceptional 8.0% |
| Bolivians | 99.9 /100 | #72 | Exceptional 8.0% |
| Immigrants | France | 99.9 /100 | #73 | Exceptional 8.0% |
| Spanish Americans | 99.8 /100 | #74 | Exceptional 8.0% |
Demographics Similar to Yakama by Unemployment Among Seniors over 75 years
In terms of unemployment among seniors over 75 years, the demographic groups most similar to Yakama are Immigrants from Yemen (16.5%, a difference of 11.7%), Tlingit-Haida (20.7%, a difference of 12.6%), Alaska Native (14.7%, a difference of 25.6%), Hmong (13.7%, a difference of 34.1%), and Lumbee (13.5%, a difference of 36.8%).
| Demographics | Rating | Rank | Unemployment Among Seniors over 75 years |
| Alaskan Athabascans | 0.0 /100 | #333 | Tragic 11.0% |
| Assyrians/Chaldeans/Syriacs | 0.0 /100 | #334 | Tragic 11.1% |
| French Canadians | 0.0 /100 | #335 | Tragic 11.2% |
| Immigrants | North Macedonia | 0.0 /100 | #336 | Tragic 11.3% |
| Cape Verdeans | 0.0 /100 | #337 | Tragic 11.4% |
| Immigrants | Cabo Verde | 0.0 /100 | #338 | Tragic 12.3% |
| Cajuns | 0.0 /100 | #339 | Tragic 12.5% |
| Yup'ik | 0.0 /100 | #340 | Tragic 12.8% |
| Lumbee | 0.0 /100 | #341 | Tragic 13.5% |
| Hmong | 0.0 /100 | #342 | Tragic 13.7% |
| Alaska Natives | 0.0 /100 | #343 | Tragic 14.7% |
| Immigrants | Yemen | 0.0 /100 | #344 | Tragic 16.5% |
| Yakama | 0.0 /100 | #345 | Tragic 18.4% |
| Tlingit-Haida | 0.0 /100 | #346 | Tragic 20.7% |