Immigrants from Syria vs Barbadian Unemployment Among Ages 60 to 64 years

COMPARE

Immigrants from Syria
Race
Ancestry
AfghanAfricanAlaska NativeAlaskan AthabascanAlbanianAleutAlsatianAmericanApacheArabArapahoArgentineanArmenianAssyrian/Chaldean/SyriacAustralianAustrianBahamianBangladeshiBasqueBelgianBelizeanBermudanBhutaneseBlackfeetBolivianBrazilianBritishBritish West IndianBulgarianBurmeseCajunCambodianCanadianCape VerdeanCarpatho RusynCelticCentral AmericanCentral American IndianCherokeeCheyenneChickasawChileanChineseChippewaChoctawColombianColvilleComancheCosta RicanCreeCreekCroatianCrowCubanCypriotCzechCzechoslovakianDanishDelawareDominicanDutchDutch West IndianEastern EuropeanEcuadorianEgyptianEnglishEstonianEthiopianEuropeanFijianFilipinoFinnishFrenchFrench American IndianFrench CanadianGermanGerman RussianGhanaianGreekGuamanian/ChamorroGuatemalanGuyaneseHaitianHmongHonduranHopiHoumaHungarianIcelanderIndian (Asian)IndonesianInupiatIranianIraqiIrishIroquoisIsraeliItalianJamaicanJapaneseJordanianKenyanKiowaKoreanLaotianLatvianLebaneseLiberianLithuanianLumbeeLuxembourgerMacedonianMalaysianMalteseMarshalleseMenomineeMexicanMexican American IndianMongolianMoroccanNative HawaiianNavajoNepaleseNew ZealanderNicaraguanNigerianNorthern EuropeanNorwegianOkinawanOsageOttawaPaiutePakistaniPalestinianPanamanianParaguayanPennsylvania GermanPeruvianPimaPolishPortuguesePotawatomiPuebloPuerto RicanPuget Sound SalishRomanianRussianSalvadoranSamoanScandinavianScotch-IrishScottishSeminoleSenegaleseSerbianShoshoneSierra LeoneanSiouxSlavicSlovakSloveneSomaliSouth AfricanSouth AmericanSouth American IndianSoviet UnionSpaniardSpanishSpanish AmericanSpanish American IndianSri LankanSubsaharan AfricanSudaneseSwedishSwissSyrianTaiwaneseThaiTlingit-HaidaTohono O'OdhamTonganTrinidadian and TobagonianTsimshianTurkishU.S. Virgin IslanderUgandanUkrainianUruguayanUteVenezuelanVietnameseWelshWest IndianYakamaYaquiYugoslavianYumanYup'ikZimbabwean
Immigration
NonimmigrantsImmigrantsAfghanistanAfricaAlbaniaArgentinaArmeniaAsiaAustraliaAustriaBahamasBangladeshBarbadosBelarusBelgiumBelizeBoliviaBosnia and HerzegovinaBrazilBulgariaBurma/MyanmarCabo VerdeCambodiaCameroonCanadaCaribbeanCentral AmericaChileChinaColombiaCongoCosta RicaCroatiaCubaCzechoslovakiaDenmarkDominicaDominican RepublicEastern AfricaEastern AsiaEastern EuropeEcuadorEgyptEl SalvadorEnglandEritreaEthiopiaEuropeFijiFranceGermanyGhanaGreeceGrenadaGuatemalaGuyanaHaitiHondurasHong KongHungaryIndiaIndonesiaIranIraqIrelandIsraelItalyJamaicaJapanJordanKazakhstanKenyaKoreaKuwaitLaosLatin AmericaLatviaLebanonLiberiaLithuaniaMalaysiaMexicoMicronesiaMiddle AfricaMoldovaMoroccoNepalNetherlandsNicaraguaNigeriaNorth AmericaNorth MacedoniaNorthern AfricaNorthern EuropeNorwayOceaniaPakistanPanamaPeruPhilippinesPolandPortugalRomaniaRussiaSaudi ArabiaScotlandSenegalSerbiaSierra LeoneSingaporeSomaliaSouth AfricaSouth AmericaSouth Central AsiaSouth Eastern AsiaSouthern EuropeSpainSri LankaSt. Vincent and the GrenadinesSudanSwedenSwitzerlandSyriaTaiwanThailandTrinidad and TobagoTurkeyUgandaUkraineUruguayUzbekistanVenezuelaVietnamWest IndiesWestern AfricaWestern AsiaWestern EuropeYemenZaireZimbabweAzores
Barbadian
Race
Ancestry
AfghanAfricanAlaska NativeAlaskan AthabascanAlbanianAleutAlsatianAmericanApacheArabArapahoArgentineanArmenianAssyrian/Chaldean/SyriacAustralianAustrianBahamianBangladeshiBarbadianBasqueBelgianBelizeanBermudanBhutaneseBlackfeetBolivianBrazilianBritishBritish West IndianBulgarianBurmeseCajunCambodianCanadianCape VerdeanCarpatho RusynCelticCentral AmericanCentral American IndianCherokeeCheyenneChickasawChileanChineseChippewaChoctawColombianColvilleComancheCosta RicanCreeCreekCroatianCrowCubanCypriotCzechCzechoslovakianDanishDelawareDominicanDutchDutch West IndianEastern EuropeanEcuadorianEgyptianEnglishEstonianEthiopianEuropeanFijianFilipinoFinnishFrenchFrench American IndianFrench CanadianGermanGerman RussianGhanaianGreekGuamanian/ChamorroGuatemalanGuyaneseHaitianHmongHonduranHopiHoumaHungarianIcelanderIndian (Asian)IndonesianInupiatIranianIraqiIrishIroquoisIsraeliItalianJamaicanJapaneseJordanianKenyanKiowaKoreanLaotianLatvianLebaneseLiberianLithuanianLumbeeLuxembourgerMacedonianMalaysianMalteseMarshalleseMenomineeMexicanMexican American IndianMongolianMoroccanNative HawaiianNavajoNepaleseNew ZealanderNicaraguanNigerianNorthern EuropeanNorwegianOkinawanOsageOttawaPaiutePakistaniPalestinianPanamanianParaguayanPennsylvania GermanPeruvianPimaPolishPortuguesePotawatomiPuebloPuerto RicanPuget Sound SalishRomanianRussianSalvadoranSamoanScandinavianScotch-IrishScottishSeminoleSenegaleseSerbianShoshoneSierra LeoneanSiouxSlavicSlovakSloveneSomaliSouth AfricanSouth AmericanSouth American IndianSoviet UnionSpaniardSpanishSpanish AmericanSpanish American IndianSri LankanSubsaharan AfricanSudaneseSwedishSwissSyrianTaiwaneseThaiTlingit-HaidaTohono O'OdhamTonganTrinidadian and TobagonianTsimshianTurkishU.S. Virgin IslanderUgandanUkrainianUruguayanUteVenezuelanVietnameseWelshWest IndianYakamaYaquiYugoslavianYumanYup'ikZimbabwean
Immigration
NonimmigrantsImmigrantsAfghanistanAfricaAlbaniaArgentinaArmeniaAsiaAustraliaAustriaBahamasBangladeshBarbadosBelarusBelgiumBelizeBoliviaBosnia and HerzegovinaBrazilBulgariaBurma/MyanmarCabo VerdeCambodiaCameroonCanadaCaribbeanCentral AmericaChileChinaColombiaCongoCosta RicaCroatiaCubaCzechoslovakiaDenmarkDominicaDominican RepublicEastern AfricaEastern AsiaEastern EuropeEcuadorEgyptEl SalvadorEnglandEritreaEthiopiaEuropeFijiFranceGermanyGhanaGreeceGrenadaGuatemalaGuyanaHaitiHondurasHong KongHungaryIndiaIndonesiaIranIraqIrelandIsraelItalyJamaicaJapanJordanKazakhstanKenyaKoreaKuwaitLaosLatin AmericaLatviaLebanonLiberiaLithuaniaMalaysiaMexicoMicronesiaMiddle AfricaMoldovaMoroccoNepalNetherlandsNicaraguaNigeriaNorth AmericaNorth MacedoniaNorthern AfricaNorthern EuropeNorwayOceaniaPakistanPanamaPeruPhilippinesPolandPortugalRomaniaRussiaSaudi ArabiaScotlandSenegalSerbiaSierra LeoneSingaporeSomaliaSouth AfricaSouth AmericaSouth Central AsiaSouth Eastern AsiaSouthern EuropeSpainSri LankaSt. Vincent and the GrenadinesSudanSwedenSwitzerlandTaiwanThailandTrinidad and TobagoTurkeyUgandaUkraineUruguayUzbekistanVenezuelaVietnamWest IndiesWestern AfricaWestern AsiaWestern EuropeYemenZaireZimbabweAzores
Unemployment Among Ages 60 to 64 years
Income
Poverty
Unemployment
Labor Participation
Family Structure
Vehicle Availability
Education Level
Disability

Unemployment Among Ages 60 to 64 years Comparison

Immigrants from Syria

Barbadians

Exceptional
Tragic
4.8%
UNEMPLOYMENT AMONG AGES 60 TO 64 YEARS
90.1/ 100
METRIC RATING
130th/ 347
METRIC RANK
5.4%
UNEMPLOYMENT AMONG AGES 60 TO 64 YEARS
0.0/ 100
METRIC RATING
302nd/ 347
METRIC RANK

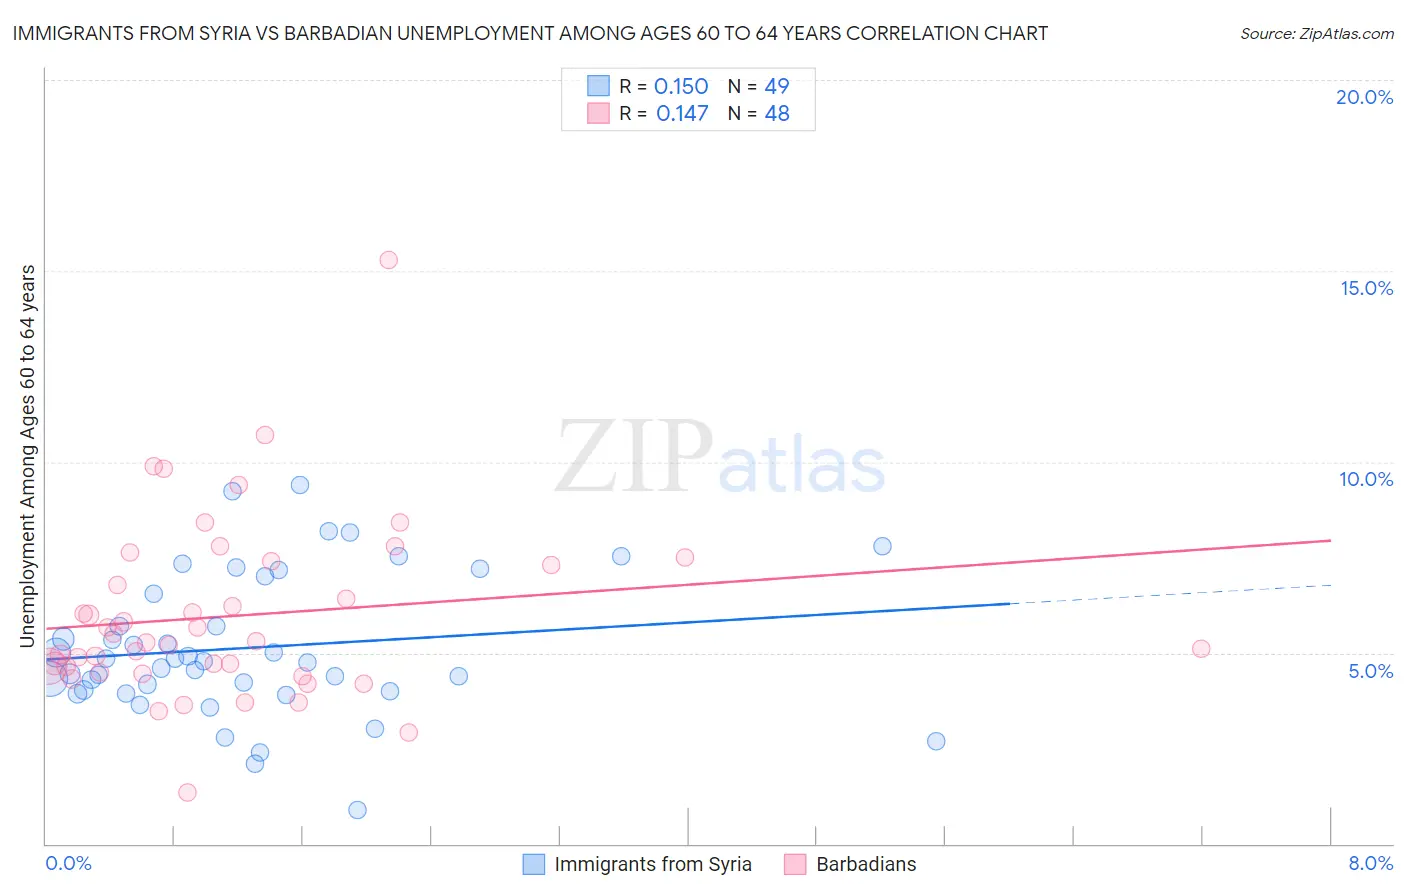
Immigrants from Syria vs Barbadian Unemployment Among Ages 60 to 64 years Correlation Chart

The statistical analysis conducted on geographies consisting of 167,840,010 people shows a poor positive correlation between the proportion of Immigrants from Syria and unemployment rate among population between the ages 60 and 64 in the United States with a correlation coefficient (R) of 0.150 and weighted average of 4.8%. Similarly, the statistical analysis conducted on geographies consisting of 136,407,444 people shows a poor positive correlation between the proportion of Barbadians and unemployment rate among population between the ages 60 and 64 in the United States with a correlation coefficient (R) of 0.147 and weighted average of 5.4%, a difference of 13.1%.
Immigrants from Syria vs Barbadian Unemployment Among Ages 60 to 64 years

Unemployment Among Ages 60 to 64 years Correlation Summary

MeasurementImmigrants from SyriaBarbadian
Minimum0.90%1.3%
Maximum9.4%15.3%
Range8.5%13.9%
Mean5.1%6.0%
Median4.8%5.3%
Interquartile 25% (IQ1)4.0%4.6%
Interquartile 75% (IQ3)6.8%7.3%
Interquartile Range (IQR)2.8%2.8%
Standard Deviation (Sample)1.9%2.4%
Standard Deviation (Population)1.8%2.3%

Similar Demographics by Unemployment Among Ages 60 to 64 years

Demographics Similar to Immigrants from Syria by Unemployment Among Ages 60 to 64 years

In terms of unemployment among ages 60 to 64 years, the demographic groups most similar to Immigrants from Syria are Immigrants from Serbia (4.8%, a difference of 0.010%), Choctaw (4.8%, a difference of 0.020%), Immigrants from Lebanon (4.8%, a difference of 0.050%), Lithuanian (4.8%, a difference of 0.060%), and Yaqui (4.8%, a difference of 0.070%).
DemographicsRating | RankUnemployment Among Ages 60 to 64 years
Finns
94.7
/100
|
#123
Exceptional
4.7%
Immigrants | Senegal
94.5
/100
|
#124
Exceptional
4.7%
Immigrants | Thailand
93.7
/100
|
#125
Exceptional
4.7%
Immigrants | South Central Asia
93.0
/100
|
#126
Exceptional
4.7%
Austrians
91.9
/100
|
#127
Exceptional
4.8%
Choctaw
90.3
/100
|
#128
Exceptional
4.8%
Immigrants | Serbia
90.2
/100
|
#129
Exceptional
4.8%
Immigrants | Syria
90.1
/100
|
#130
Exceptional
4.8%
Immigrants | Lebanon
89.6
/100
|
#131
Excellent
4.8%
Lithuanians
89.6
/100
|
#132
Excellent
4.8%
Yaqui
89.5
/100
|
#133
Excellent
4.8%
Basques
88.8
/100
|
#134
Excellent
4.8%
Pennsylvania Germans
87.8
/100
|
#135
Excellent
4.8%
French Canadians
87.6
/100
|
#136
Excellent
4.8%
Cambodians
86.9
/100
|
#137
Excellent
4.8%

Demographics Similar to Barbadians by Unemployment Among Ages 60 to 64 years

In terms of unemployment among ages 60 to 64 years, the demographic groups most similar to Barbadians are Bahamian (5.4%, a difference of 0.10%), Immigrants from Mexico (5.4%, a difference of 0.14%), Cypriot (5.4%, a difference of 0.16%), Immigrants from Dominica (5.4%, a difference of 0.24%), and Immigrants from Jamaica (5.4%, a difference of 0.40%).
DemographicsRating | RankUnemployment Among Ages 60 to 64 years
Armenians
0.0
/100
|
#295
Tragic
5.3%
Jamaicans
0.0
/100
|
#296
Tragic
5.3%
Osage
0.0
/100
|
#297
Tragic
5.4%
Immigrants | Central America
0.0
/100
|
#298
Tragic
5.4%
Immigrants | El Salvador
0.0
/100
|
#299
Tragic
5.4%
Immigrants | Barbados
0.0
/100
|
#300
Tragic
5.4%
Immigrants | Jamaica
0.0
/100
|
#301
Tragic
5.4%
Barbadians
0.0
/100
|
#302
Tragic
5.4%
Bahamians
0.0
/100
|
#303
Tragic
5.4%
Immigrants | Mexico
0.0
/100
|
#304
Tragic
5.4%
Cypriots
0.0
/100
|
#305
Tragic
5.4%
Immigrants | Dominica
0.0
/100
|
#306
Tragic
5.4%
Immigrants | Guyana
0.0
/100
|
#307
Tragic
5.4%
Spanish American Indians
0.0
/100
|
#308
Tragic
5.4%
Soviet Union
0.0
/100
|
#309
Tragic
5.4%