Immigrants from Switzerland vs Nonimmigrants Unemployment Among Women with Children Under 6 years
COMPARE
Immigrants from Switzerland
Nonimmigrants
Unemployment Among Women with Children Under 6 years
Unemployment Among Women with Children Under 6 years Comparison
Immigrants from Switzerland
Nonimmigrants
6.8%
UNEMPLOYMENT AMONG WOMEN WITH CHILDREN UNDER 6 YEARS
99.9/ 100
METRIC RATING
48th/ 347
METRIC RANK
8.8%
UNEMPLOYMENT AMONG WOMEN WITH CHILDREN UNDER 6 YEARS
0.0/ 100
METRIC RATING
294th/ 347
METRIC RANK
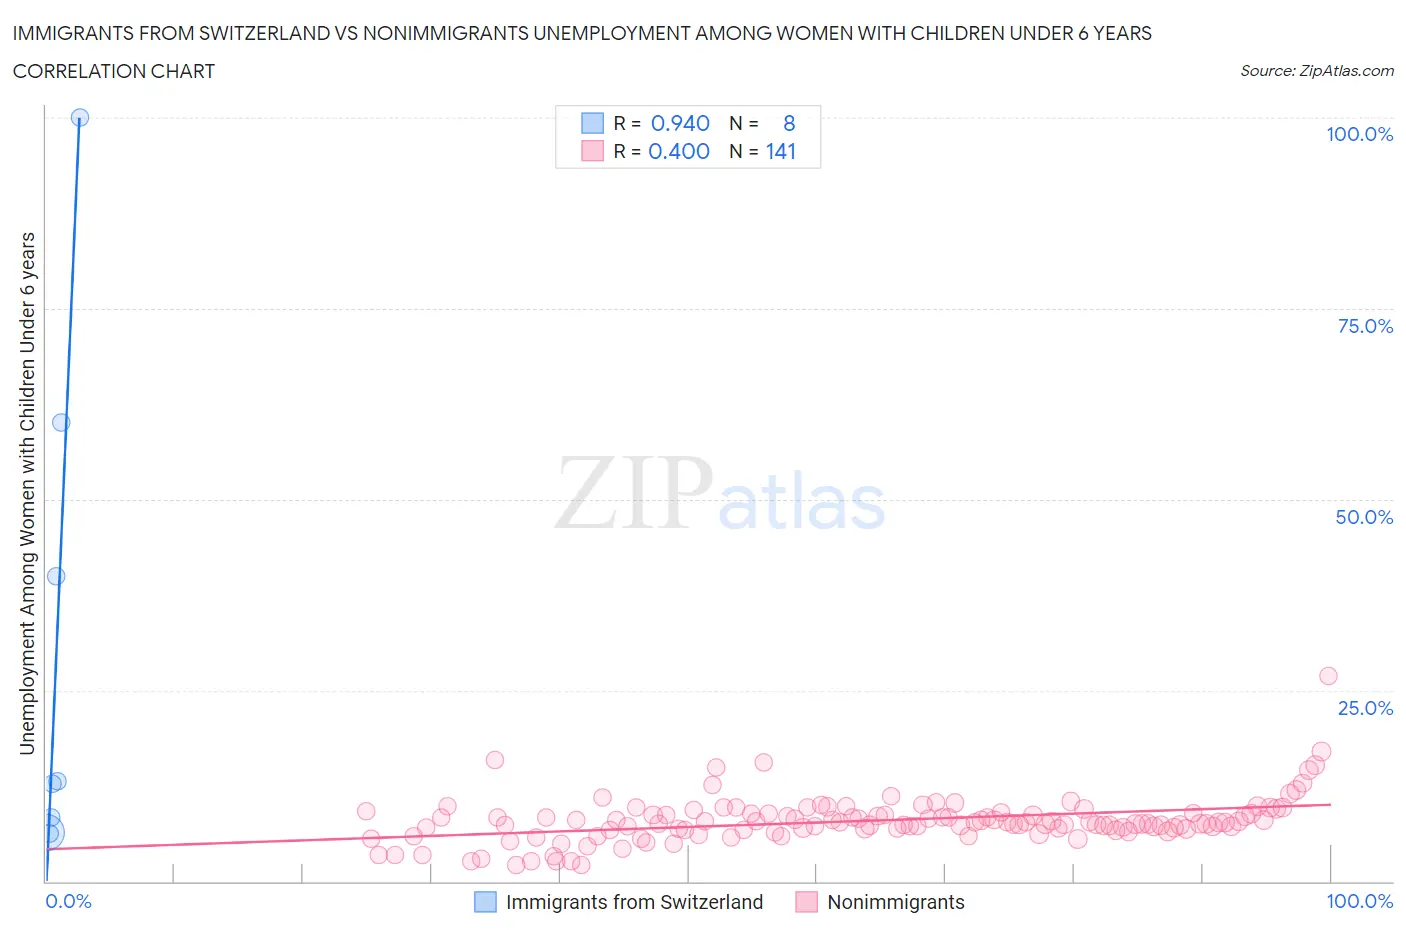
Immigrants from Switzerland vs Nonimmigrants Unemployment Among Women with Children Under 6 years Correlation Chart
The statistical analysis conducted on geographies consisting of 124,679,791 people shows a near-perfect positive correlation between the proportion of Immigrants from Switzerland and unemployment rate among women with children under the age of 6 in the United States with a correlation coefficient (R) of 0.940 and weighted average of 6.8%. Similarly, the statistical analysis conducted on geographies consisting of 381,284,375 people shows a mild positive correlation between the proportion of Nonimmigrants and unemployment rate among women with children under the age of 6 in the United States with a correlation coefficient (R) of 0.400 and weighted average of 8.8%, a difference of 30.5%.
Unemployment Among Women with Children Under 6 years Correlation Summary
| Measurement | Immigrants from Switzerland | Nonimmigrants |
| Minimum | 6.3% | 2.1% |
| Maximum | 100.0% | 26.9% |
| Range | 93.7% | 24.8% |
| Mean | 30.9% | 8.0% |
| Median | 13.0% | 7.7% |
| Interquartile 25% (IQ1) | 7.4% | 6.8% |
| Interquartile 75% (IQ3) | 50.0% | 8.8% |
| Interquartile Range (IQR) | 42.5% | 2.1% |
| Standard Deviation (Sample) | 33.9% | 3.0% |
| Standard Deviation (Population) | 31.7% | 3.0% |
Similar Demographics by Unemployment Among Women with Children Under 6 years
Demographics Similar to Immigrants from Switzerland by Unemployment Among Women with Children Under 6 years
In terms of unemployment among women with children under 6 years, the demographic groups most similar to Immigrants from Switzerland are Immigrants from Asia (6.8%, a difference of 0.030%), Immigrants from Nepal (6.8%, a difference of 0.050%), Immigrants from Ireland (6.8%, a difference of 0.060%), Ethiopian (6.8%, a difference of 0.080%), and Immigrants from Iran (6.8%, a difference of 0.19%).
| Demographics | Rating | Rank | Unemployment Among Women with Children Under 6 years |
| Immigrants | Indonesia | 99.9 /100 | #41 | Exceptional 6.7% |
| Immigrants | Cuba | 99.9 /100 | #42 | Exceptional 6.7% |
| Bhutanese | 99.9 /100 | #43 | Exceptional 6.7% |
| Iranians | 99.9 /100 | #44 | Exceptional 6.7% |
| Immigrants | Australia | 99.9 /100 | #45 | Exceptional 6.8% |
| Latvians | 99.9 /100 | #46 | Exceptional 6.8% |
| Immigrants | Asia | 99.9 /100 | #47 | Exceptional 6.8% |
| Immigrants | Switzerland | 99.9 /100 | #48 | Exceptional 6.8% |
| Immigrants | Nepal | 99.9 /100 | #49 | Exceptional 6.8% |
| Immigrants | Ireland | 99.9 /100 | #50 | Exceptional 6.8% |
| Ethiopians | 99.9 /100 | #51 | Exceptional 6.8% |
| Immigrants | Iran | 99.9 /100 | #52 | Exceptional 6.8% |
| Chinese | 99.9 /100 | #53 | Exceptional 6.8% |
| Immigrants | Latvia | 99.9 /100 | #54 | Exceptional 6.8% |
| Immigrants | Ukraine | 99.8 /100 | #55 | Exceptional 6.8% |
Demographics Similar to Nonimmigrants by Unemployment Among Women with Children Under 6 years
In terms of unemployment among women with children under 6 years, the demographic groups most similar to Nonimmigrants are Immigrants from Central America (8.9%, a difference of 0.050%), Immigrants from Dominican Republic (8.9%, a difference of 0.18%), Immigrants from Bangladesh (8.8%, a difference of 0.19%), Mexican (8.9%, a difference of 0.27%), and Cheyenne (8.8%, a difference of 0.42%).
| Demographics | Rating | Rank | Unemployment Among Women with Children Under 6 years |
| Menominee | 0.0 /100 | #287 | Tragic 8.7% |
| Bahamians | 0.0 /100 | #288 | Tragic 8.7% |
| Iroquois | 0.0 /100 | #289 | Tragic 8.7% |
| Vietnamese | 0.0 /100 | #290 | Tragic 8.8% |
| Jamaicans | 0.0 /100 | #291 | Tragic 8.8% |
| Cheyenne | 0.0 /100 | #292 | Tragic 8.8% |
| Immigrants | Bangladesh | 0.0 /100 | #293 | Tragic 8.8% |
| Immigrants | Nonimmigrants | 0.0 /100 | #294 | Tragic 8.8% |
| Immigrants | Central America | 0.0 /100 | #295 | Tragic 8.9% |
| Immigrants | Dominican Republic | 0.0 /100 | #296 | Tragic 8.9% |
| Mexicans | 0.0 /100 | #297 | Tragic 8.9% |
| Tlingit-Haida | 0.0 /100 | #298 | Tragic 8.9% |
| Immigrants | Jamaica | 0.0 /100 | #299 | Tragic 8.9% |
| Creek | 0.0 /100 | #300 | Tragic 8.9% |
| Chickasaw | 0.0 /100 | #301 | Tragic 9.0% |