Immigrants from Switzerland vs Immigrants from North America Unemployment Among Ages 45 to 54 years
COMPARE
Immigrants from Switzerland
Immigrants from North America
Unemployment Among Ages 45 to 54 years
Unemployment Among Ages 45 to 54 years Comparison
Immigrants from Switzerland
Immigrants from North America
4.6%
UNEMPLOYMENT AMONG AGES 45 TO 54 YEARS
14.0/ 100
METRIC RATING
206th/ 347
METRIC RANK
4.4%
UNEMPLOYMENT AMONG AGES 45 TO 54 YEARS
93.9/ 100
METRIC RATING
101st/ 347
METRIC RANK
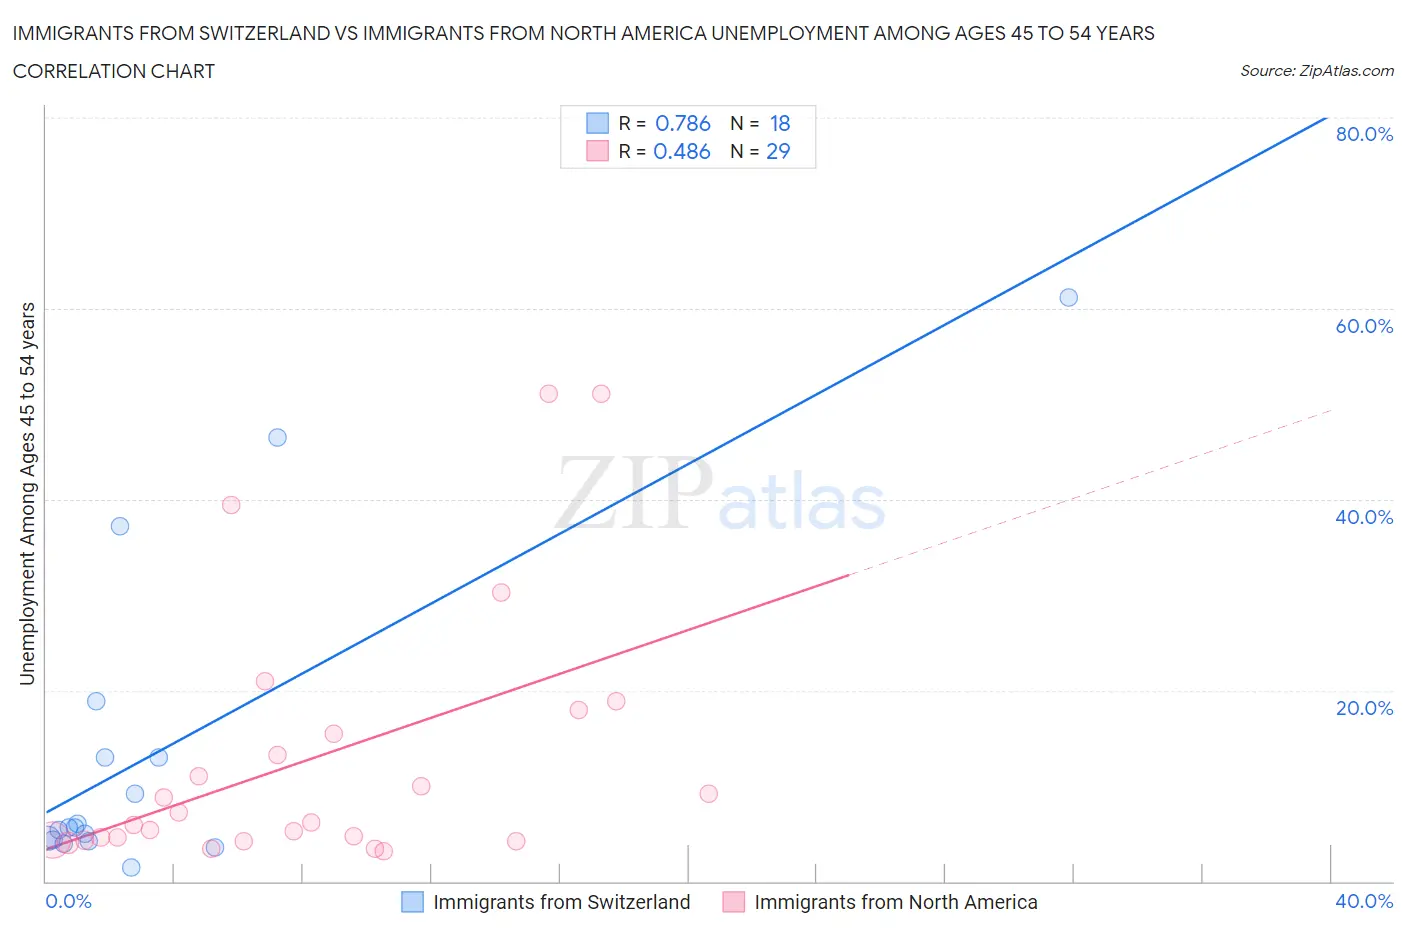
Immigrants from Switzerland vs Immigrants from North America Unemployment Among Ages 45 to 54 years Correlation Chart
The statistical analysis conducted on geographies consisting of 146,494,644 people shows a strong positive correlation between the proportion of Immigrants from Switzerland and unemployment rate among population between the ages 45 and 54 in the United States with a correlation coefficient (R) of 0.786 and weighted average of 4.6%. Similarly, the statistical analysis conducted on geographies consisting of 444,829,430 people shows a moderate positive correlation between the proportion of Immigrants from North America and unemployment rate among population between the ages 45 and 54 in the United States with a correlation coefficient (R) of 0.486 and weighted average of 4.4%, a difference of 5.5%.
Unemployment Among Ages 45 to 54 years Correlation Summary
| Measurement | Immigrants from Switzerland | Immigrants from North America |
| Minimum | 1.5% | 3.2% |
| Maximum | 61.1% | 51.1% |
| Range | 59.6% | 47.9% |
| Mean | 13.8% | 12.8% |
| Median | 5.6% | 6.2% |
| Interquartile 25% (IQ1) | 4.3% | 4.3% |
| Interquartile 75% (IQ3) | 13.0% | 16.7% |
| Interquartile Range (IQR) | 8.7% | 12.4% |
| Standard Deviation (Sample) | 16.9% | 13.6% |
| Standard Deviation (Population) | 16.4% | 13.4% |
Similar Demographics by Unemployment Among Ages 45 to 54 years
Demographics Similar to Immigrants from Switzerland by Unemployment Among Ages 45 to 54 years
In terms of unemployment among ages 45 to 54 years, the demographic groups most similar to Immigrants from Switzerland are Arab (4.6%, a difference of 0.030%), Immigrants from Africa (4.6%, a difference of 0.050%), Immigrants from Nigeria (4.6%, a difference of 0.070%), Immigrants from South America (4.6%, a difference of 0.18%), and Immigrants from Greece (4.6%, a difference of 0.20%).
| Demographics | Rating | Rank | Unemployment Among Ages 45 to 54 years |
| Brazilians | 20.1 /100 | #199 | Fair 4.6% |
| Immigrants | Denmark | 19.8 /100 | #200 | Poor 4.6% |
| Immigrants | Costa Rica | 19.7 /100 | #201 | Poor 4.6% |
| Immigrants | Peru | 19.1 /100 | #202 | Poor 4.6% |
| Liberians | 18.7 /100 | #203 | Poor 4.6% |
| Immigrants | Morocco | 16.8 /100 | #204 | Poor 4.6% |
| Immigrants | Greece | 16.2 /100 | #205 | Poor 4.6% |
| Immigrants | Switzerland | 14.0 /100 | #206 | Poor 4.6% |
| Arabs | 13.7 /100 | #207 | Poor 4.6% |
| Immigrants | Africa | 13.6 /100 | #208 | Poor 4.6% |
| Immigrants | Nigeria | 13.3 /100 | #209 | Poor 4.6% |
| Immigrants | South America | 12.2 /100 | #210 | Poor 4.6% |
| Creek | 11.9 /100 | #211 | Poor 4.6% |
| Immigrants | Iran | 11.5 /100 | #212 | Poor 4.6% |
| Panamanians | 10.7 /100 | #213 | Poor 4.6% |
Demographics Similar to Immigrants from North America by Unemployment Among Ages 45 to 54 years
In terms of unemployment among ages 45 to 54 years, the demographic groups most similar to Immigrants from North America are Sri Lankan (4.4%, a difference of 0.050%), Icelander (4.4%, a difference of 0.080%), Immigrants from Sweden (4.4%, a difference of 0.18%), Immigrants from Eritrea (4.4%, a difference of 0.19%), and Immigrants from Kenya (4.4%, a difference of 0.21%).
| Demographics | Rating | Rank | Unemployment Among Ages 45 to 54 years |
| Immigrants | Malaysia | 96.2 /100 | #94 | Exceptional 4.4% |
| Immigrants | Ethiopia | 96.1 /100 | #95 | Exceptional 4.4% |
| Indonesians | 95.4 /100 | #96 | Exceptional 4.4% |
| Immigrants | Canada | 95.0 /100 | #97 | Exceptional 4.4% |
| Romanians | 94.9 /100 | #98 | Exceptional 4.4% |
| Immigrants | Burma/Myanmar | 94.9 /100 | #99 | Exceptional 4.4% |
| Immigrants | Eritrea | 94.7 /100 | #100 | Exceptional 4.4% |
| Immigrants | North America | 93.9 /100 | #101 | Exceptional 4.4% |
| Sri Lankans | 93.7 /100 | #102 | Exceptional 4.4% |
| Icelanders | 93.5 /100 | #103 | Exceptional 4.4% |
| Immigrants | Sweden | 93.0 /100 | #104 | Exceptional 4.4% |
| Immigrants | Kenya | 92.8 /100 | #105 | Exceptional 4.4% |
| Iranians | 92.5 /100 | #106 | Exceptional 4.4% |
| Immigrants | South Africa | 92.5 /100 | #107 | Exceptional 4.4% |
| Russians | 92.1 /100 | #108 | Exceptional 4.4% |