Immigrants from Sweden vs Immigrants from Romania Unemployment Among Ages 35 to 44 years
COMPARE
Immigrants from Sweden
Immigrants from Romania
Unemployment Among Ages 35 to 44 years
Unemployment Among Ages 35 to 44 years Comparison
Immigrants from Sweden
Immigrants from Romania
4.4%
UNEMPLOYMENT AMONG AGES 35 TO 44 YEARS
95.9/ 100
METRIC RATING
79th/ 347
METRIC RANK
4.4%
UNEMPLOYMENT AMONG AGES 35 TO 44 YEARS
96.3/ 100
METRIC RATING
75th/ 347
METRIC RANK
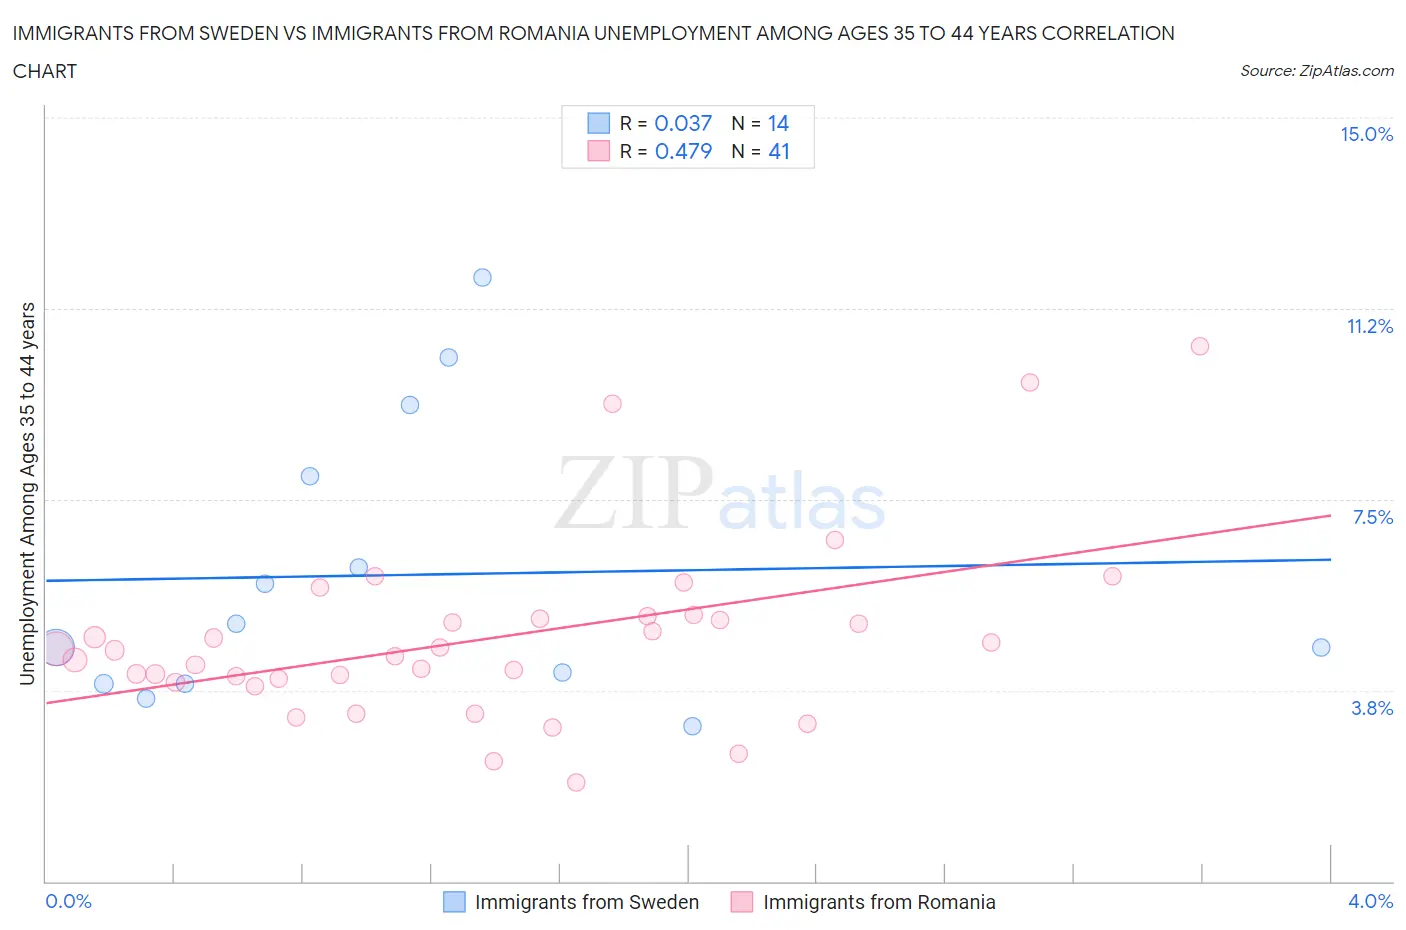
Immigrants from Sweden vs Immigrants from Romania Unemployment Among Ages 35 to 44 years Correlation Chart
The statistical analysis conducted on geographies consisting of 162,937,934 people shows no correlation between the proportion of Immigrants from Sweden and unemployment rate among population between the ages 35 and 44 in the United States with a correlation coefficient (R) of 0.037 and weighted average of 4.4%. Similarly, the statistical analysis conducted on geographies consisting of 254,056,339 people shows a moderate positive correlation between the proportion of Immigrants from Romania and unemployment rate among population between the ages 35 and 44 in the United States with a correlation coefficient (R) of 0.479 and weighted average of 4.4%, a difference of 0.23%.
Unemployment Among Ages 35 to 44 years Correlation Summary
| Measurement | Immigrants from Sweden | Immigrants from Romania |
| Minimum | 3.0% | 1.9% |
| Maximum | 11.9% | 10.5% |
| Range | 8.8% | 8.6% |
| Mean | 6.0% | 4.8% |
| Median | 4.8% | 4.5% |
| Interquartile 25% (IQ1) | 3.9% | 3.9% |
| Interquartile 75% (IQ3) | 8.0% | 5.2% |
| Interquartile Range (IQR) | 4.1% | 1.2% |
| Standard Deviation (Sample) | 2.8% | 1.8% |
| Standard Deviation (Population) | 2.7% | 1.8% |
Demographics Similar to Immigrants from Sweden and Immigrants from Romania by Unemployment Among Ages 35 to 44 years
In terms of unemployment among ages 35 to 44 years, the demographic groups most similar to Immigrants from Sweden are Indian (Asian) (4.4%, a difference of 0.050%), Kenyan (4.4%, a difference of 0.070%), Dutch (4.4%, a difference of 0.11%), Immigrants from Scotland (4.4%, a difference of 0.12%), and Immigrants from Asia (4.4%, a difference of 0.12%). Similarly, the demographic groups most similar to Immigrants from Romania are Polish (4.4%, a difference of 0.020%), Immigrants from Jordan (4.4%, a difference of 0.030%), Lithuanian (4.4%, a difference of 0.060%), Northern European (4.4%, a difference of 0.090%), and Dutch (4.4%, a difference of 0.11%).
| Demographics | Rating | Rank | Unemployment Among Ages 35 to 44 years |
| Argentineans | 96.8 /100 | #67 | Exceptional 4.4% |
| Immigrants | Ireland | 96.8 /100 | #68 | Exceptional 4.4% |
| Slovenes | 96.7 /100 | #69 | Exceptional 4.4% |
| Immigrants | China | 96.7 /100 | #70 | Exceptional 4.4% |
| Immigrants | Lithuania | 96.7 /100 | #71 | Exceptional 4.4% |
| Northern Europeans | 96.5 /100 | #72 | Exceptional 4.4% |
| Lithuanians | 96.5 /100 | #73 | Exceptional 4.4% |
| Poles | 96.4 /100 | #74 | Exceptional 4.4% |
| Immigrants | Romania | 96.3 /100 | #75 | Exceptional 4.4% |
| Immigrants | Jordan | 96.3 /100 | #76 | Exceptional 4.4% |
| Dutch | 96.1 /100 | #77 | Exceptional 4.4% |
| Indians (Asian) | 96.0 /100 | #78 | Exceptional 4.4% |
| Immigrants | Sweden | 95.9 /100 | #79 | Exceptional 4.4% |
| Kenyans | 95.7 /100 | #80 | Exceptional 4.4% |
| Immigrants | Scotland | 95.6 /100 | #81 | Exceptional 4.4% |
| Immigrants | Asia | 95.6 /100 | #82 | Exceptional 4.4% |
| Immigrants | Australia | 95.3 /100 | #83 | Exceptional 4.4% |
| Immigrants | Chile | 95.2 /100 | #84 | Exceptional 4.4% |
| Immigrants | Kenya | 95.0 /100 | #85 | Exceptional 4.4% |
| Serbians | 94.9 /100 | #86 | Exceptional 4.4% |
| Immigrants | Bosnia and Herzegovina | 94.8 /100 | #87 | Exceptional 4.4% |