Immigrants from Sweden vs German Unemployment Among Ages 25 to 29 years
COMPARE
Immigrants from Sweden
German
Unemployment Among Ages 25 to 29 years
Unemployment Among Ages 25 to 29 years Comparison
Immigrants from Sweden
Germans
6.3%
UNEMPLOYMENT AMONG AGES 25 TO 29 YEARS
95.1/ 100
METRIC RATING
85th/ 347
METRIC RANK
6.5%
UNEMPLOYMENT AMONG AGES 25 TO 29 YEARS
86.3/ 100
METRIC RATING
114th/ 347
METRIC RANK
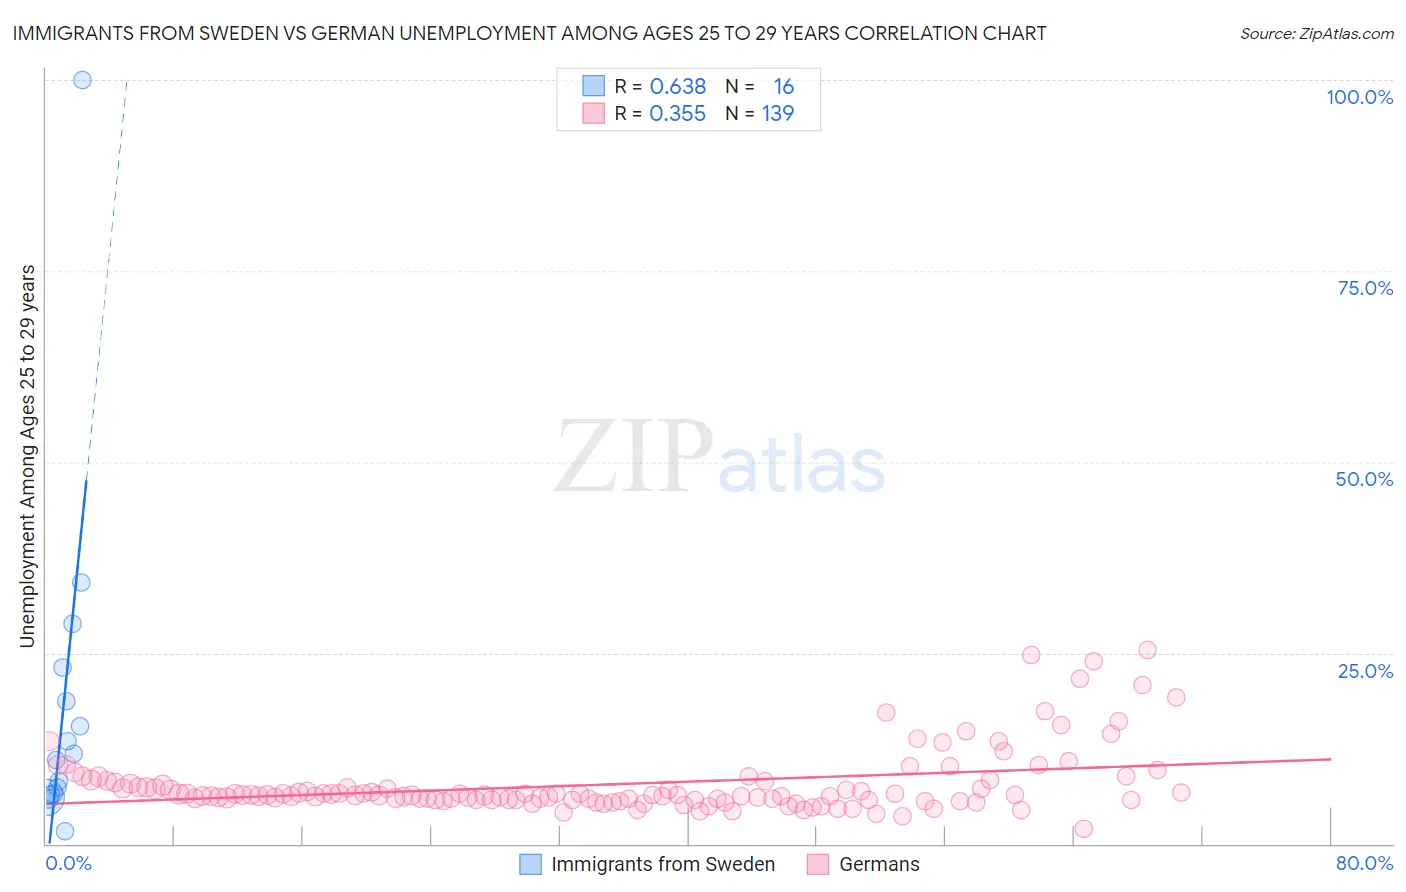
Immigrants from Sweden vs German Unemployment Among Ages 25 to 29 years Correlation Chart
The statistical analysis conducted on geographies consisting of 160,086,803 people shows a significant positive correlation between the proportion of Immigrants from Sweden and unemployment rate among population between the ages 25 and 29 in the United States with a correlation coefficient (R) of 0.638 and weighted average of 6.3%. Similarly, the statistical analysis conducted on geographies consisting of 511,129,036 people shows a mild positive correlation between the proportion of Germans and unemployment rate among population between the ages 25 and 29 in the United States with a correlation coefficient (R) of 0.355 and weighted average of 6.5%, a difference of 1.8%.
Unemployment Among Ages 25 to 29 years Correlation Summary
| Measurement | Immigrants from Sweden | German |
| Minimum | 1.7% | 2.0% |
| Maximum | 100.0% | 25.4% |
| Range | 98.3% | 23.4% |
| Mean | 18.7% | 7.8% |
| Median | 11.4% | 6.3% |
| Interquartile 25% (IQ1) | 6.5% | 5.8% |
| Interquartile 75% (IQ3) | 20.9% | 7.9% |
| Interquartile Range (IQR) | 14.4% | 2.1% |
| Standard Deviation (Sample) | 23.5% | 4.2% |
| Standard Deviation (Population) | 22.7% | 4.1% |
Similar Demographics by Unemployment Among Ages 25 to 29 years
Demographics Similar to Immigrants from Sweden by Unemployment Among Ages 25 to 29 years
In terms of unemployment among ages 25 to 29 years, the demographic groups most similar to Immigrants from Sweden are Immigrants from Spain (6.3%, a difference of 0.020%), Slovene (6.3%, a difference of 0.060%), Immigrants from Asia (6.3%, a difference of 0.10%), Marshallese (6.4%, a difference of 0.15%), and Immigrants from Poland (6.3%, a difference of 0.19%).
| Demographics | Rating | Rank | Unemployment Among Ages 25 to 29 years |
| Asians | 96.4 /100 | #78 | Exceptional 6.3% |
| Immigrants | Switzerland | 96.0 /100 | #79 | Exceptional 6.3% |
| Immigrants | Romania | 95.9 /100 | #80 | Exceptional 6.3% |
| Iranians | 95.8 /100 | #81 | Exceptional 6.3% |
| Immigrants | Poland | 95.7 /100 | #82 | Exceptional 6.3% |
| Slovenes | 95.3 /100 | #83 | Exceptional 6.3% |
| Immigrants | Spain | 95.2 /100 | #84 | Exceptional 6.3% |
| Immigrants | Sweden | 95.1 /100 | #85 | Exceptional 6.3% |
| Immigrants | Asia | 94.9 /100 | #86 | Exceptional 6.3% |
| Marshallese | 94.7 /100 | #87 | Exceptional 6.4% |
| Immigrants | Indonesia | 94.5 /100 | #88 | Exceptional 6.4% |
| Immigrants | Oceania | 94.1 /100 | #89 | Exceptional 6.4% |
| Lebanese | 93.9 /100 | #90 | Exceptional 6.4% |
| Egyptians | 93.9 /100 | #91 | Exceptional 6.4% |
| Immigrants | North Macedonia | 93.6 /100 | #92 | Exceptional 6.4% |
Demographics Similar to Germans by Unemployment Among Ages 25 to 29 years
In terms of unemployment among ages 25 to 29 years, the demographic groups most similar to Germans are Macedonian (6.5%, a difference of 0.030%), Pakistani (6.5%, a difference of 0.060%), Immigrants from Uruguay (6.5%, a difference of 0.080%), Immigrants from Egypt (6.5%, a difference of 0.11%), and Chilean (6.5%, a difference of 0.13%).
| Demographics | Rating | Rank | Unemployment Among Ages 25 to 29 years |
| Swiss | 88.6 /100 | #107 | Excellent 6.4% |
| Croatians | 88.2 /100 | #108 | Excellent 6.4% |
| Immigrants | Albania | 87.9 /100 | #109 | Excellent 6.4% |
| Europeans | 87.8 /100 | #110 | Excellent 6.4% |
| Immigrants | Colombia | 87.6 /100 | #111 | Excellent 6.4% |
| Immigrants | Nicaragua | 87.5 /100 | #112 | Excellent 6.4% |
| Immigrants | Egypt | 87.1 /100 | #113 | Excellent 6.5% |
| Germans | 86.3 /100 | #114 | Excellent 6.5% |
| Macedonians | 86.1 /100 | #115 | Excellent 6.5% |
| Pakistanis | 85.9 /100 | #116 | Excellent 6.5% |
| Immigrants | Uruguay | 85.7 /100 | #117 | Excellent 6.5% |
| Chileans | 85.3 /100 | #118 | Excellent 6.5% |
| Immigrants | South Africa | 84.9 /100 | #119 | Excellent 6.5% |
| Immigrants | Moldova | 84.5 /100 | #120 | Excellent 6.5% |
| Immigrants | Uganda | 84.5 /100 | #121 | Excellent 6.5% |