Immigrants from St. Vincent and the Grenadines vs Immigrants from Syria Unemployment Among Ages 20 to 24 years
COMPARE
Immigrants from St. Vincent and the Grenadines
Immigrants from Syria
Unemployment Among Ages 20 to 24 years
Unemployment Among Ages 20 to 24 years Comparison
Immigrants from St. Vincent and the Grenadines
Immigrants from Syria
14.3%
UNEMPLOYMENT AMONG AGES 20 TO 24 YEARS
0.0/ 100
METRIC RATING
338th/ 347
METRIC RANK
10.8%
UNEMPLOYMENT AMONG AGES 20 TO 24 YEARS
0.4/ 100
METRIC RATING
252nd/ 347
METRIC RANK
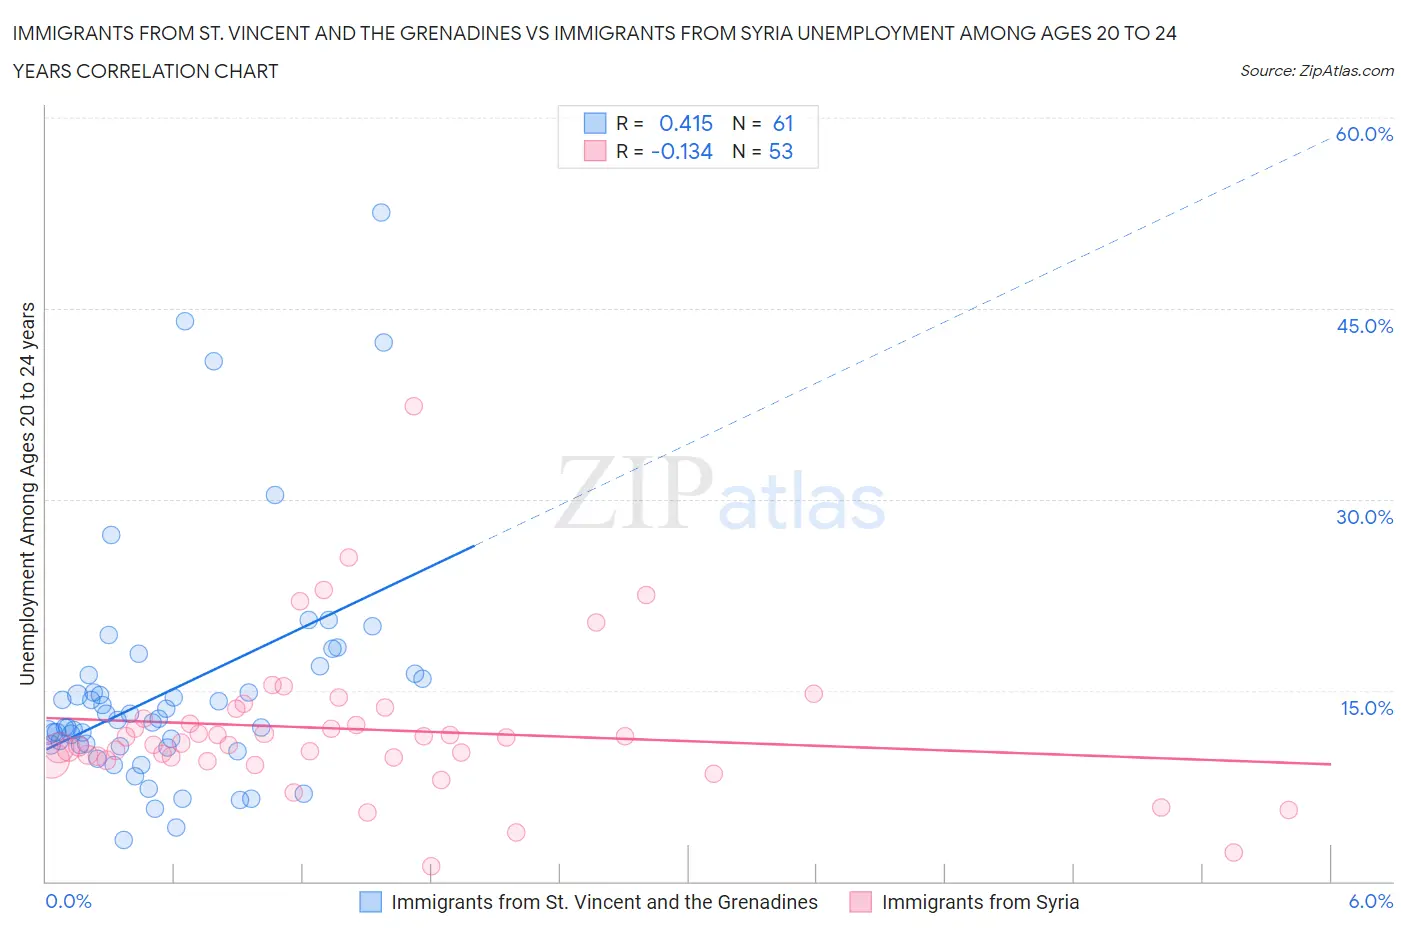
Immigrants from St. Vincent and the Grenadines vs Immigrants from Syria Unemployment Among Ages 20 to 24 years Correlation Chart
The statistical analysis conducted on geographies consisting of 55,881,091 people shows a moderate positive correlation between the proportion of Immigrants from St. Vincent and the Grenadines and unemployment rate among population between the ages 20 and 24 in the United States with a correlation coefficient (R) of 0.415 and weighted average of 14.3%. Similarly, the statistical analysis conducted on geographies consisting of 172,426,776 people shows a poor negative correlation between the proportion of Immigrants from Syria and unemployment rate among population between the ages 20 and 24 in the United States with a correlation coefficient (R) of -0.134 and weighted average of 10.8%, a difference of 32.5%.
Unemployment Among Ages 20 to 24 years Correlation Summary
| Measurement | Immigrants from St. Vincent and the Grenadines | Immigrants from Syria |
| Minimum | 3.2% | 1.2% |
| Maximum | 52.5% | 37.3% |
| Range | 49.3% | 36.1% |
| Mean | 15.1% | 11.9% |
| Median | 12.7% | 10.9% |
| Interquartile 25% (IQ1) | 10.7% | 9.6% |
| Interquartile 75% (IQ3) | 16.3% | 13.1% |
| Interquartile Range (IQR) | 5.6% | 3.5% |
| Standard Deviation (Sample) | 9.4% | 5.9% |
| Standard Deviation (Population) | 9.3% | 5.8% |
Similar Demographics by Unemployment Among Ages 20 to 24 years
Demographics Similar to Immigrants from St. Vincent and the Grenadines by Unemployment Among Ages 20 to 24 years
In terms of unemployment among ages 20 to 24 years, the demographic groups most similar to Immigrants from St. Vincent and the Grenadines are Paiute (14.3%, a difference of 0.010%), Pima (14.2%, a difference of 1.1%), Sioux (14.2%, a difference of 1.3%), Guyanese (14.0%, a difference of 2.5%), and Immigrants from Guyana (13.9%, a difference of 3.0%).
| Demographics | Rating | Rank | Unemployment Among Ages 20 to 24 years |
| Aleuts | 0.0 /100 | #331 | Tragic 13.8% |
| Immigrants | Grenada | 0.0 /100 | #332 | Tragic 13.8% |
| Immigrants | Guyana | 0.0 /100 | #333 | Tragic 13.9% |
| Guyanese | 0.0 /100 | #334 | Tragic 14.0% |
| Sioux | 0.0 /100 | #335 | Tragic 14.2% |
| Pima | 0.0 /100 | #336 | Tragic 14.2% |
| Paiute | 0.0 /100 | #337 | Tragic 14.3% |
| Immigrants | St. Vincent and the Grenadines | 0.0 /100 | #338 | Tragic 14.3% |
| Immigrants | Yemen | 0.0 /100 | #339 | Tragic 14.9% |
| Yuman | 0.0 /100 | #340 | Tragic 15.8% |
| Navajo | 0.0 /100 | #341 | Tragic 16.1% |
| Puerto Ricans | 0.0 /100 | #342 | Tragic 16.7% |
| Tsimshian | 0.0 /100 | #343 | Tragic 18.0% |
| Crow | 0.0 /100 | #344 | Tragic 18.7% |
| Hopi | 0.0 /100 | #345 | Tragic 19.9% |
Demographics Similar to Immigrants from Syria by Unemployment Among Ages 20 to 24 years
In terms of unemployment among ages 20 to 24 years, the demographic groups most similar to Immigrants from Syria are Spanish American (10.8%, a difference of 0.050%), Immigrants from Panama (10.8%, a difference of 0.060%), Albanian (10.8%, a difference of 0.13%), South American Indian (10.8%, a difference of 0.17%), and Liberian (10.8%, a difference of 0.17%).
| Demographics | Rating | Rank | Unemployment Among Ages 20 to 24 years |
| Hispanics or Latinos | 1.0 /100 | #245 | Tragic 10.7% |
| Immigrants | Iran | 0.9 /100 | #246 | Tragic 10.8% |
| Immigrants | Albania | 0.7 /100 | #247 | Tragic 10.8% |
| Cree | 0.6 /100 | #248 | Tragic 10.8% |
| South American Indians | 0.5 /100 | #249 | Tragic 10.8% |
| Albanians | 0.5 /100 | #250 | Tragic 10.8% |
| Immigrants | Panama | 0.4 /100 | #251 | Tragic 10.8% |
| Immigrants | Syria | 0.4 /100 | #252 | Tragic 10.8% |
| Spanish Americans | 0.4 /100 | #253 | Tragic 10.8% |
| Liberians | 0.3 /100 | #254 | Tragic 10.8% |
| Immigrants | Israel | 0.3 /100 | #255 | Tragic 10.8% |
| Immigrants | Bahamas | 0.3 /100 | #256 | Tragic 10.9% |
| Immigrants | Western Asia | 0.3 /100 | #257 | Tragic 10.9% |
| Dutch West Indians | 0.3 /100 | #258 | Tragic 10.9% |
| Panamanians | 0.2 /100 | #259 | Tragic 10.9% |