Immigrants from St. Vincent and the Grenadines vs Immigrants from Northern Europe Unemployment Among Women with Children Under 18 years
COMPARE
Immigrants from St. Vincent and the Grenadines
Immigrants from Northern Europe
Unemployment Among Women with Children Under 18 years
Unemployment Among Women with Children Under 18 years Comparison
Immigrants from St. Vincent and the Grenadines
Immigrants from Northern Europe
6.3%
UNEMPLOYMENT AMONG WOMEN WITH CHILDREN UNDER 18 YEARS
0.0/ 100
METRIC RATING
282nd/ 347
METRIC RANK
5.1%
UNEMPLOYMENT AMONG WOMEN WITH CHILDREN UNDER 18 YEARS
95.9/ 100
METRIC RATING
74th/ 347
METRIC RANK
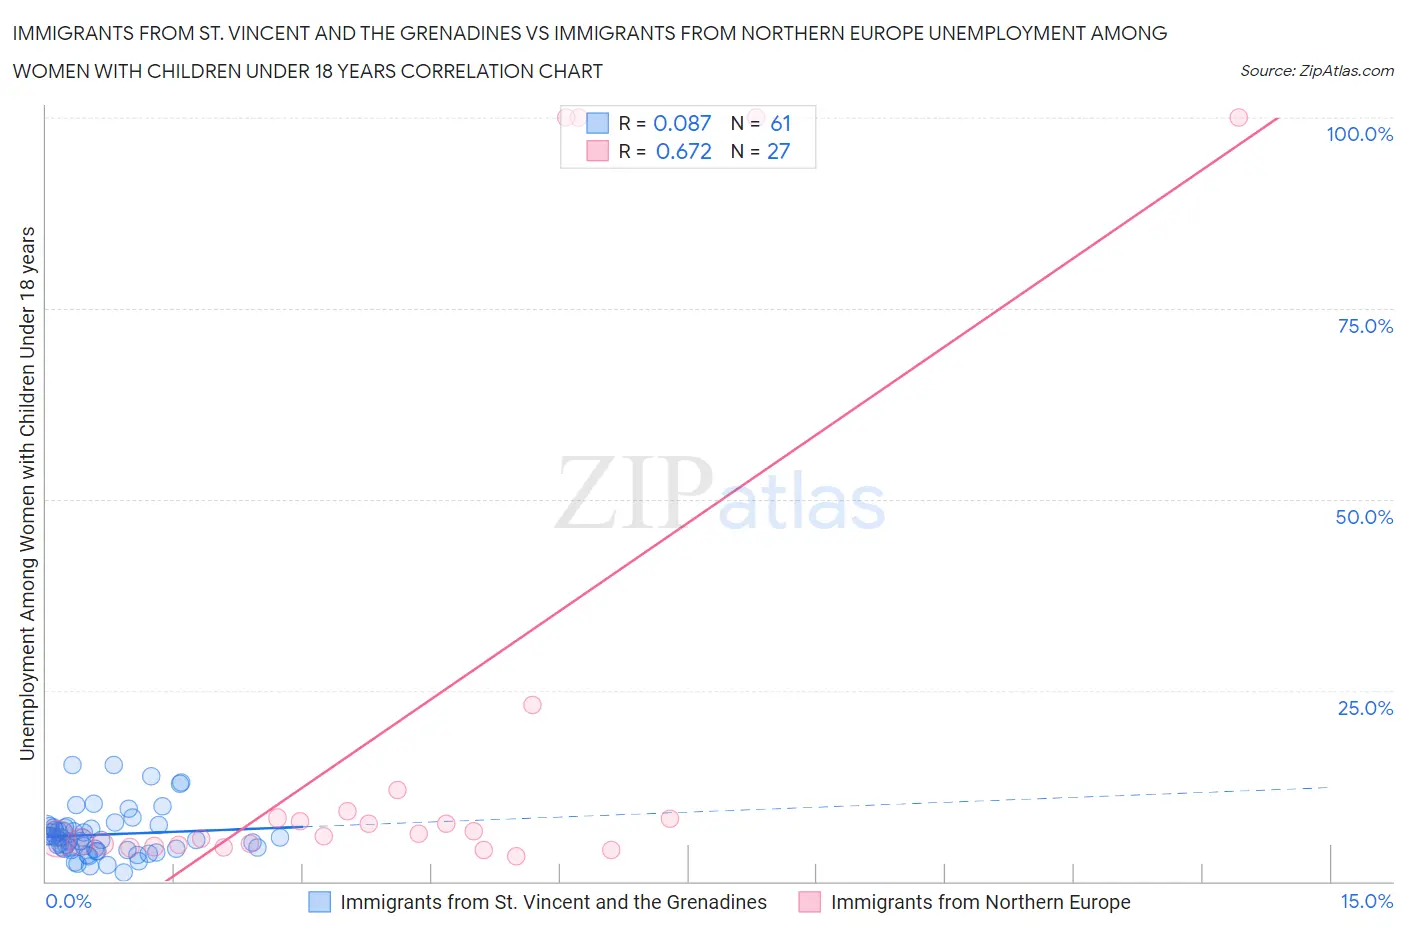
Immigrants from St. Vincent and the Grenadines vs Immigrants from Northern Europe Unemployment Among Women with Children Under 18 years Correlation Chart
The statistical analysis conducted on geographies consisting of 55,884,650 people shows a slight positive correlation between the proportion of Immigrants from St. Vincent and the Grenadines and unemployment rate among women with children under the age of 18 in the United States with a correlation coefficient (R) of 0.087 and weighted average of 6.3%. Similarly, the statistical analysis conducted on geographies consisting of 449,375,747 people shows a significant positive correlation between the proportion of Immigrants from Northern Europe and unemployment rate among women with children under the age of 18 in the United States with a correlation coefficient (R) of 0.672 and weighted average of 5.1%, a difference of 22.5%.
Unemployment Among Women with Children Under 18 years Correlation Summary
| Measurement | Immigrants from St. Vincent and the Grenadines | Immigrants from Northern Europe |
| Minimum | 1.2% | 3.3% |
| Maximum | 15.3% | 100.0% |
| Range | 14.1% | 96.7% |
| Mean | 6.1% | 20.7% |
| Median | 5.7% | 6.2% |
| Interquartile 25% (IQ1) | 4.2% | 4.8% |
| Interquartile 75% (IQ3) | 7.1% | 9.1% |
| Interquartile Range (IQR) | 2.9% | 4.3% |
| Standard Deviation (Sample) | 3.1% | 33.9% |
| Standard Deviation (Population) | 3.1% | 33.3% |
Similar Demographics by Unemployment Among Women with Children Under 18 years
Demographics Similar to Immigrants from St. Vincent and the Grenadines by Unemployment Among Women with Children Under 18 years
In terms of unemployment among women with children under 18 years, the demographic groups most similar to Immigrants from St. Vincent and the Grenadines are Immigrants from El Salvador (6.3%, a difference of 0.010%), Guatemalan (6.3%, a difference of 0.17%), West Indian (6.3%, a difference of 0.18%), Immigrants from Grenada (6.3%, a difference of 0.22%), and Bahamian (6.3%, a difference of 0.37%).
| Demographics | Rating | Rank | Unemployment Among Women with Children Under 18 years |
| Dutch West Indians | 0.0 /100 | #275 | Tragic 6.2% |
| Immigrants | Ghana | 0.0 /100 | #276 | Tragic 6.2% |
| Mexican American Indians | 0.0 /100 | #277 | Tragic 6.2% |
| Immigrants | Barbados | 0.0 /100 | #278 | Tragic 6.2% |
| Immigrants | Portugal | 0.0 /100 | #279 | Tragic 6.3% |
| Guatemalans | 0.0 /100 | #280 | Tragic 6.3% |
| Immigrants | El Salvador | 0.0 /100 | #281 | Tragic 6.3% |
| Immigrants | St. Vincent and the Grenadines | 0.0 /100 | #282 | Tragic 6.3% |
| West Indians | 0.0 /100 | #283 | Tragic 6.3% |
| Immigrants | Grenada | 0.0 /100 | #284 | Tragic 6.3% |
| Bahamians | 0.0 /100 | #285 | Tragic 6.3% |
| Alaskan Athabascans | 0.0 /100 | #286 | Tragic 6.3% |
| Kiowa | 0.0 /100 | #287 | Tragic 6.3% |
| Cree | 0.0 /100 | #288 | Tragic 6.3% |
| Immigrants | Caribbean | 0.0 /100 | #289 | Tragic 6.4% |
Demographics Similar to Immigrants from Northern Europe by Unemployment Among Women with Children Under 18 years
In terms of unemployment among women with children under 18 years, the demographic groups most similar to Immigrants from Northern Europe are Albanian (5.1%, a difference of 0.010%), Immigrants from Asia (5.1%, a difference of 0.030%), Puget Sound Salish (5.1%, a difference of 0.060%), Immigrants from Bolivia (5.1%, a difference of 0.080%), and Zimbabwean (5.1%, a difference of 0.080%).
| Demographics | Rating | Rank | Unemployment Among Women with Children Under 18 years |
| Fijians | 96.9 /100 | #67 | Exceptional 5.1% |
| Irish | 96.8 /100 | #68 | Exceptional 5.1% |
| Austrians | 96.6 /100 | #69 | Exceptional 5.1% |
| Icelanders | 96.6 /100 | #70 | Exceptional 5.1% |
| Serbians | 96.5 /100 | #71 | Exceptional 5.1% |
| Immigrants | Bolivia | 96.1 /100 | #72 | Exceptional 5.1% |
| Albanians | 95.9 /100 | #73 | Exceptional 5.1% |
| Immigrants | Northern Europe | 95.9 /100 | #74 | Exceptional 5.1% |
| Immigrants | Asia | 95.8 /100 | #75 | Exceptional 5.1% |
| Puget Sound Salish | 95.8 /100 | #76 | Exceptional 5.1% |
| Zimbabweans | 95.7 /100 | #77 | Exceptional 5.1% |
| Assyrians/Chaldeans/Syriacs | 95.7 /100 | #78 | Exceptional 5.1% |
| Immigrants | Croatia | 95.6 /100 | #79 | Exceptional 5.1% |
| Bolivians | 95.5 /100 | #80 | Exceptional 5.1% |
| Immigrants | Lithuania | 95.4 /100 | #81 | Exceptional 5.2% |