Immigrants from Spain vs Immigrants from Western Asia Unemployment Among Ages 65 to 74 years
COMPARE
Immigrants from Spain
Immigrants from Western Asia
Unemployment Among Ages 65 to 74 years
Unemployment Among Ages 65 to 74 years Comparison
Immigrants from Spain
Immigrants from Western Asia
5.4%
UNEMPLOYMENT AMONG AGES 65 TO 74 YEARS
37.3/ 100
METRIC RATING
183rd/ 347
METRIC RANK
5.4%
UNEMPLOYMENT AMONG AGES 65 TO 74 YEARS
14.9/ 100
METRIC RATING
201st/ 347
METRIC RANK
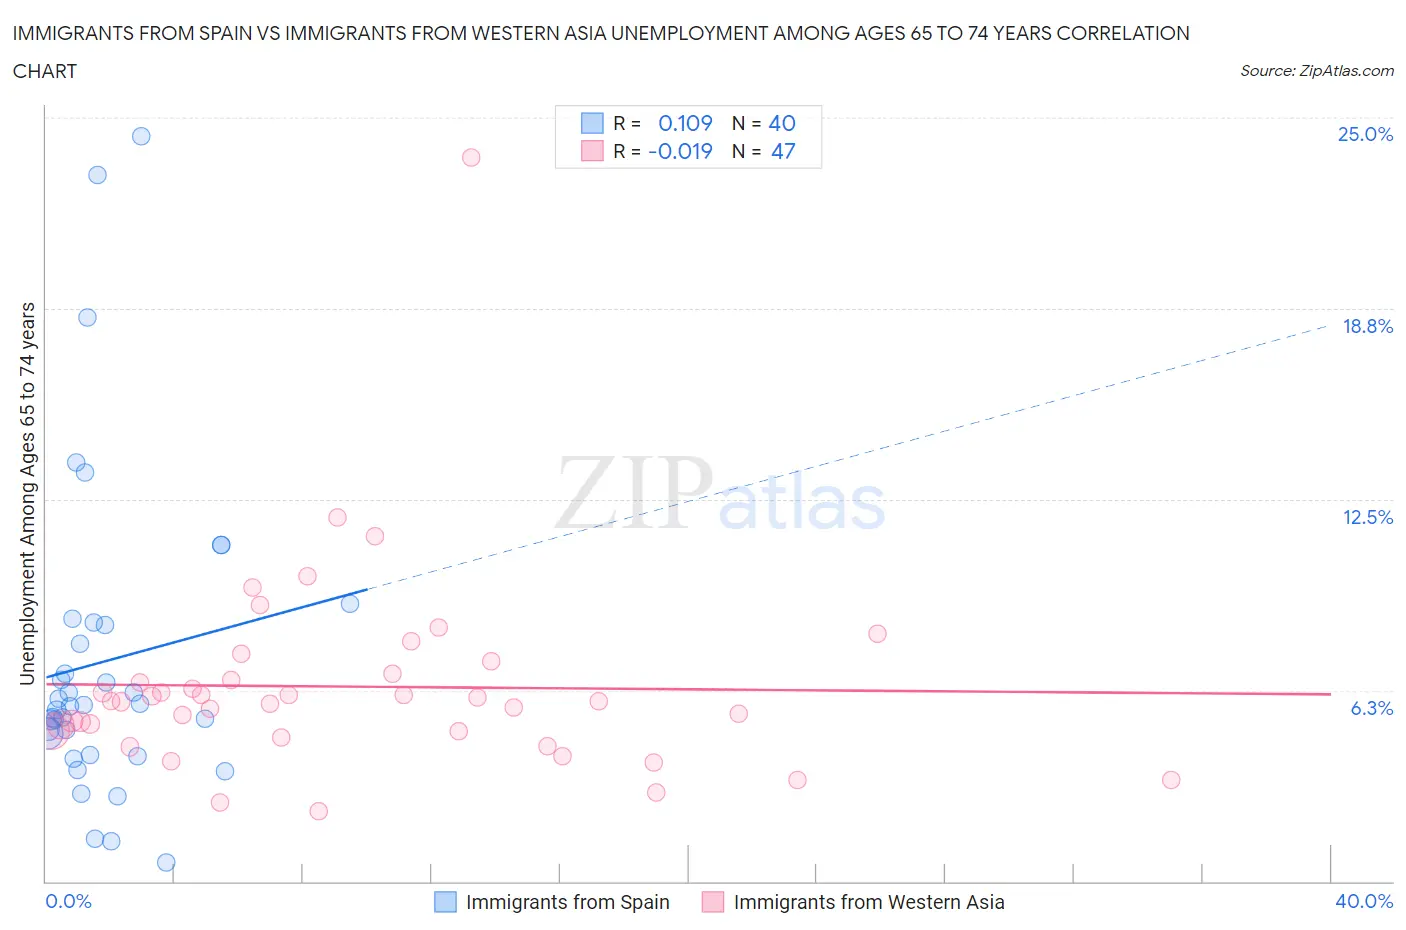
Immigrants from Spain vs Immigrants from Western Asia Unemployment Among Ages 65 to 74 years Correlation Chart
The statistical analysis conducted on geographies consisting of 223,058,481 people shows a poor positive correlation between the proportion of Immigrants from Spain and unemployment rate among population between the ages 65 and 74 in the United States with a correlation coefficient (R) of 0.109 and weighted average of 5.4%. Similarly, the statistical analysis conducted on geographies consisting of 359,374,008 people shows no correlation between the proportion of Immigrants from Western Asia and unemployment rate among population between the ages 65 and 74 in the United States with a correlation coefficient (R) of -0.019 and weighted average of 5.4%, a difference of 1.0%.
Unemployment Among Ages 65 to 74 years Correlation Summary
| Measurement | Immigrants from Spain | Immigrants from Western Asia |
| Minimum | 0.60% | 2.3% |
| Maximum | 24.4% | 23.7% |
| Range | 23.8% | 21.4% |
| Mean | 7.2% | 6.4% |
| Median | 5.8% | 5.9% |
| Interquartile 25% (IQ1) | 4.5% | 4.9% |
| Interquartile 75% (IQ3) | 8.4% | 6.8% |
| Interquartile Range (IQR) | 4.0% | 1.9% |
| Standard Deviation (Sample) | 5.2% | 3.3% |
| Standard Deviation (Population) | 5.1% | 3.3% |
Demographics Similar to Immigrants from Spain and Immigrants from Western Asia by Unemployment Among Ages 65 to 74 years
In terms of unemployment among ages 65 to 74 years, the demographic groups most similar to Immigrants from Spain are Spanish American (5.4%, a difference of 0.030%), Immigrants from Senegal (5.4%, a difference of 0.080%), Russian (5.4%, a difference of 0.11%), Lithuanian (5.4%, a difference of 0.18%), and Nonimmigrants (5.4%, a difference of 0.25%). Similarly, the demographic groups most similar to Immigrants from Western Asia are Immigrants from Pakistan (5.4%, a difference of 0.020%), Subsaharan African (5.4%, a difference of 0.030%), Immigrants from Belgium (5.4%, a difference of 0.080%), Albanian (5.4%, a difference of 0.18%), and Colville (5.4%, a difference of 0.32%).
| Demographics | Rating | Rank | Unemployment Among Ages 65 to 74 years |
| Spanish Americans | 38.2 /100 | #182 | Fair 5.4% |
| Immigrants | Spain | 37.3 /100 | #183 | Fair 5.4% |
| Immigrants | Senegal | 35.2 /100 | #184 | Fair 5.4% |
| Russians | 34.4 /100 | #185 | Fair 5.4% |
| Lithuanians | 32.4 /100 | #186 | Fair 5.4% |
| Immigrants | Nonimmigrants | 30.6 /100 | #187 | Fair 5.4% |
| Immigrants | Europe | 28.8 /100 | #188 | Fair 5.4% |
| Immigrants | Africa | 28.3 /100 | #189 | Fair 5.4% |
| Basques | 26.6 /100 | #190 | Fair 5.4% |
| Immigrants | Egypt | 26.5 /100 | #191 | Fair 5.4% |
| Maltese | 26.4 /100 | #192 | Fair 5.4% |
| Cherokee | 25.8 /100 | #193 | Fair 5.4% |
| Immigrants | Denmark | 24.7 /100 | #194 | Fair 5.4% |
| Immigrants | China | 24.2 /100 | #195 | Fair 5.4% |
| Costa Ricans | 21.1 /100 | #196 | Fair 5.4% |
| Colville | 20.4 /100 | #197 | Fair 5.4% |
| Albanians | 17.8 /100 | #198 | Poor 5.4% |
| Immigrants | Belgium | 16.2 /100 | #199 | Poor 5.4% |
| Immigrants | Pakistan | 15.2 /100 | #200 | Poor 5.4% |
| Immigrants | Western Asia | 14.9 /100 | #201 | Poor 5.4% |
| Sub-Saharan Africans | 14.4 /100 | #202 | Poor 5.4% |