Immigrants from Spain vs Immigrants from Denmark Unemployment Among Ages 25 to 29 years
COMPARE
Immigrants from Spain
Immigrants from Denmark
Unemployment Among Ages 25 to 29 years
Unemployment Among Ages 25 to 29 years Comparison
Immigrants from Spain
Immigrants from Denmark
6.3%
UNEMPLOYMENT AMONG AGES 25 TO 29 YEARS
95.2/ 100
METRIC RATING
84th/ 347
METRIC RANK
6.8%
UNEMPLOYMENT AMONG AGES 25 TO 29 YEARS
19.0/ 100
METRIC RATING
207th/ 347
METRIC RANK
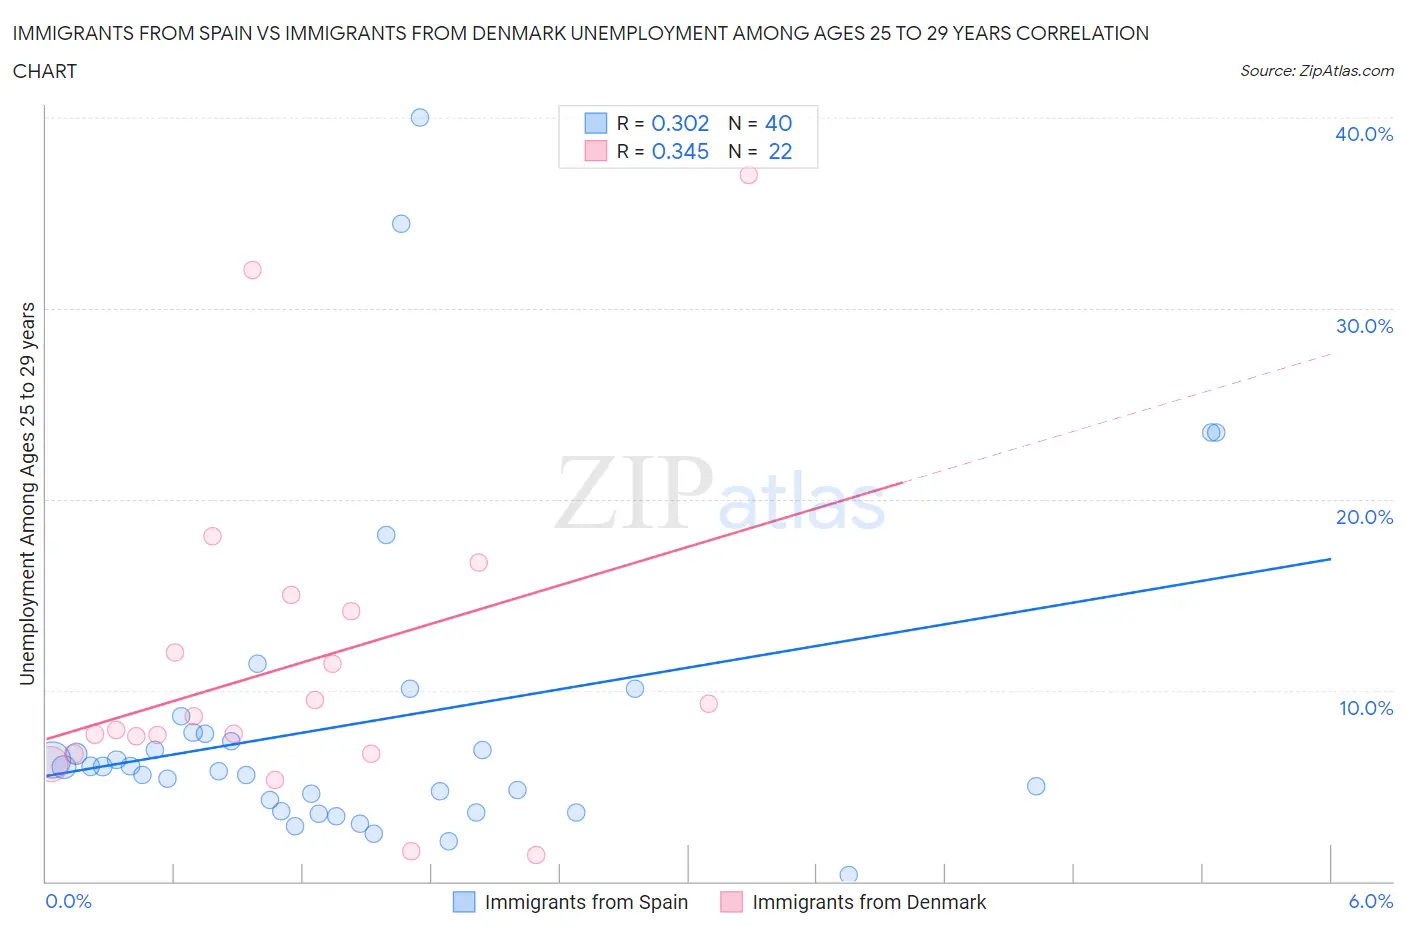
Immigrants from Spain vs Immigrants from Denmark Unemployment Among Ages 25 to 29 years Correlation Chart
The statistical analysis conducted on geographies consisting of 233,530,428 people shows a mild positive correlation between the proportion of Immigrants from Spain and unemployment rate among population between the ages 25 and 29 in the United States with a correlation coefficient (R) of 0.302 and weighted average of 6.3%. Similarly, the statistical analysis conducted on geographies consisting of 133,123,977 people shows a mild positive correlation between the proportion of Immigrants from Denmark and unemployment rate among population between the ages 25 and 29 in the United States with a correlation coefficient (R) of 0.345 and weighted average of 6.8%, a difference of 7.2%.
Unemployment Among Ages 25 to 29 years Correlation Summary
| Measurement | Immigrants from Spain | Immigrants from Denmark |
| Minimum | 0.30% | 1.4% |
| Maximum | 40.0% | 37.0% |
| Range | 39.7% | 35.6% |
| Mean | 8.3% | 11.4% |
| Median | 6.0% | 8.3% |
| Interquartile 25% (IQ1) | 4.0% | 6.7% |
| Interquartile 75% (IQ3) | 7.8% | 14.1% |
| Interquartile Range (IQR) | 3.8% | 7.4% |
| Standard Deviation (Sample) | 8.3% | 8.6% |
| Standard Deviation (Population) | 8.2% | 8.4% |
Similar Demographics by Unemployment Among Ages 25 to 29 years
Demographics Similar to Immigrants from Spain by Unemployment Among Ages 25 to 29 years
In terms of unemployment among ages 25 to 29 years, the demographic groups most similar to Immigrants from Spain are Immigrants from Sweden (6.3%, a difference of 0.020%), Slovene (6.3%, a difference of 0.040%), Immigrants from Asia (6.3%, a difference of 0.12%), Immigrants from Poland (6.3%, a difference of 0.17%), and Marshallese (6.4%, a difference of 0.17%).
| Demographics | Rating | Rank | Unemployment Among Ages 25 to 29 years |
| Icelanders | 96.6 /100 | #77 | Exceptional 6.3% |
| Asians | 96.4 /100 | #78 | Exceptional 6.3% |
| Immigrants | Switzerland | 96.0 /100 | #79 | Exceptional 6.3% |
| Immigrants | Romania | 95.9 /100 | #80 | Exceptional 6.3% |
| Iranians | 95.8 /100 | #81 | Exceptional 6.3% |
| Immigrants | Poland | 95.7 /100 | #82 | Exceptional 6.3% |
| Slovenes | 95.3 /100 | #83 | Exceptional 6.3% |
| Immigrants | Spain | 95.2 /100 | #84 | Exceptional 6.3% |
| Immigrants | Sweden | 95.1 /100 | #85 | Exceptional 6.3% |
| Immigrants | Asia | 94.9 /100 | #86 | Exceptional 6.3% |
| Marshallese | 94.7 /100 | #87 | Exceptional 6.4% |
| Immigrants | Indonesia | 94.5 /100 | #88 | Exceptional 6.4% |
| Immigrants | Oceania | 94.1 /100 | #89 | Exceptional 6.4% |
| Lebanese | 93.9 /100 | #90 | Exceptional 6.4% |
| Egyptians | 93.9 /100 | #91 | Exceptional 6.4% |
Demographics Similar to Immigrants from Denmark by Unemployment Among Ages 25 to 29 years
In terms of unemployment among ages 25 to 29 years, the demographic groups most similar to Immigrants from Denmark are Immigrants from Germany (6.8%, a difference of 0.020%), Ugandan (6.8%, a difference of 0.070%), Immigrants from England (6.8%, a difference of 0.080%), Scotch-Irish (6.8%, a difference of 0.090%), and Hawaiian (6.8%, a difference of 0.20%).
| Demographics | Rating | Rank | Unemployment Among Ages 25 to 29 years |
| South American Indians | 23.3 /100 | #200 | Fair 6.8% |
| Basques | 22.5 /100 | #201 | Fair 6.8% |
| Immigrants | Argentina | 21.6 /100 | #202 | Fair 6.8% |
| Immigrants | Norway | 21.2 /100 | #203 | Fair 6.8% |
| Scotch-Irish | 20.0 /100 | #204 | Poor 6.8% |
| Immigrants | England | 19.8 /100 | #205 | Poor 6.8% |
| Ugandans | 19.8 /100 | #206 | Poor 6.8% |
| Immigrants | Denmark | 19.0 /100 | #207 | Poor 6.8% |
| Immigrants | Germany | 18.8 /100 | #208 | Poor 6.8% |
| Hawaiians | 17.1 /100 | #209 | Poor 6.8% |
| Canadians | 16.9 /100 | #210 | Poor 6.8% |
| Immigrants | Philippines | 16.7 /100 | #211 | Poor 6.8% |
| Immigrants | Cabo Verde | 16.2 /100 | #212 | Poor 6.8% |
| Immigrants | Syria | 15.1 /100 | #213 | Poor 6.8% |
| Liberians | 14.7 /100 | #214 | Poor 6.8% |