Immigrants from Southern Europe vs Guyanese Unemployment Among Women with Children Under 18 years
COMPARE
Immigrants from Southern Europe
Guyanese
Unemployment Among Women with Children Under 18 years
Unemployment Among Women with Children Under 18 years Comparison
Immigrants from Southern Europe
Guyanese
5.5%
UNEMPLOYMENT AMONG WOMEN WITH CHILDREN UNDER 18 YEARS
42.7/ 100
METRIC RATING
180th/ 347
METRIC RANK
6.6%
UNEMPLOYMENT AMONG WOMEN WITH CHILDREN UNDER 18 YEARS
0.0/ 100
METRIC RATING
310th/ 347
METRIC RANK
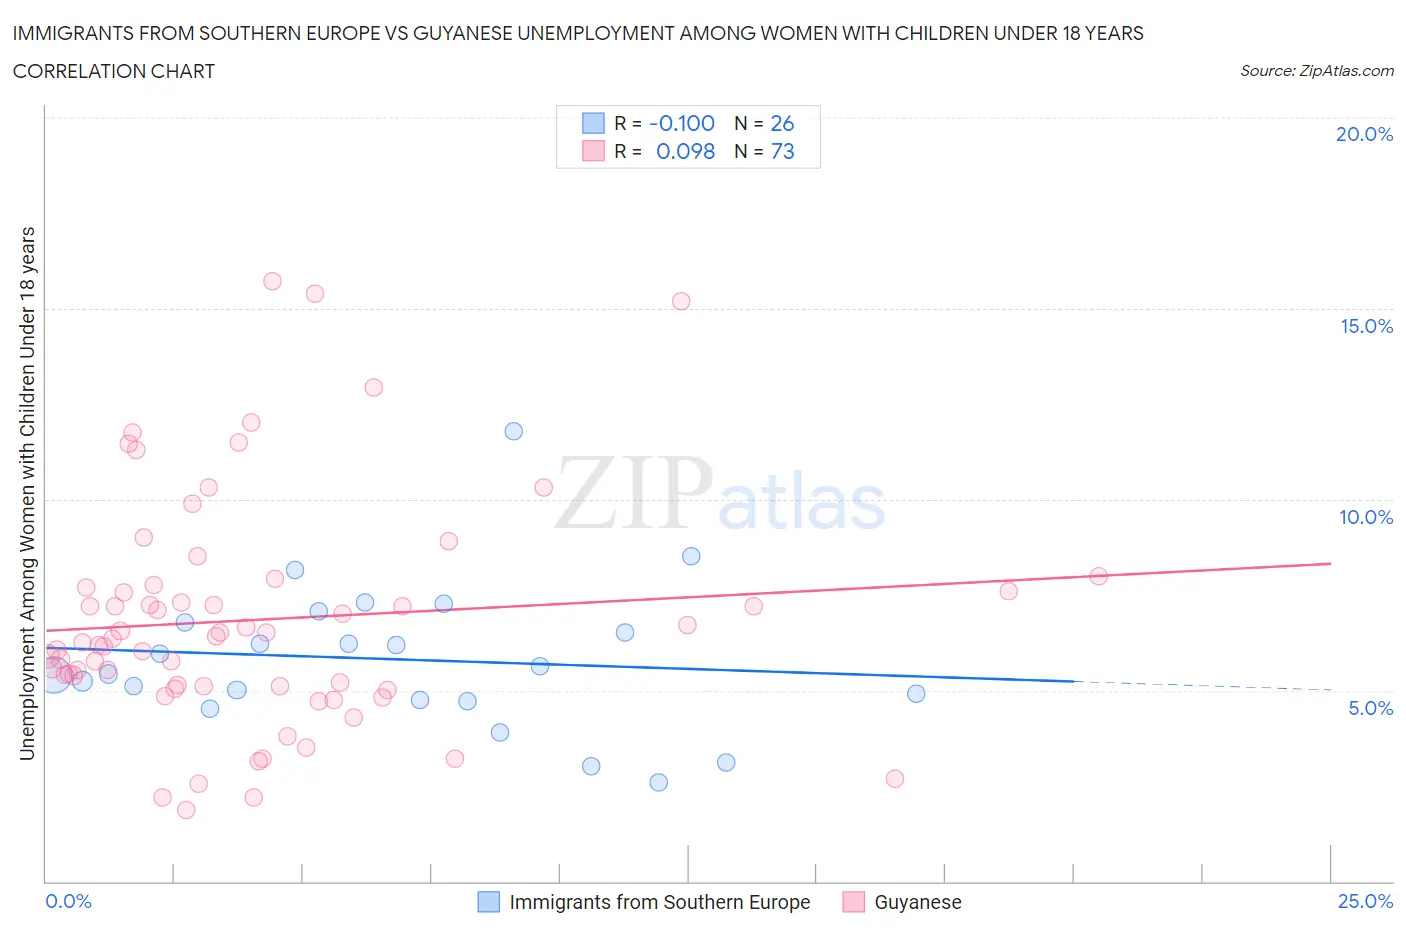
Immigrants from Southern Europe vs Guyanese Unemployment Among Women with Children Under 18 years Correlation Chart
The statistical analysis conducted on geographies consisting of 385,218,256 people shows a slight negative correlation between the proportion of Immigrants from Southern Europe and unemployment rate among women with children under the age of 18 in the United States with a correlation coefficient (R) of -0.100 and weighted average of 5.5%. Similarly, the statistical analysis conducted on geographies consisting of 173,822,653 people shows a slight positive correlation between the proportion of Guyanese and unemployment rate among women with children under the age of 18 in the United States with a correlation coefficient (R) of 0.098 and weighted average of 6.6%, a difference of 19.8%.
Unemployment Among Women with Children Under 18 years Correlation Summary
| Measurement | Immigrants from Southern Europe | Guyanese |
| Minimum | 2.6% | 1.9% |
| Maximum | 11.8% | 15.7% |
| Range | 9.2% | 13.8% |
| Mean | 5.8% | 6.9% |
| Median | 5.5% | 6.4% |
| Interquartile 25% (IQ1) | 4.7% | 5.1% |
| Interquartile 75% (IQ3) | 6.8% | 7.7% |
| Interquartile Range (IQR) | 2.0% | 2.6% |
| Standard Deviation (Sample) | 1.9% | 3.0% |
| Standard Deviation (Population) | 1.9% | 3.0% |
Similar Demographics by Unemployment Among Women with Children Under 18 years
Demographics Similar to Immigrants from Southern Europe by Unemployment Among Women with Children Under 18 years
In terms of unemployment among women with children under 18 years, the demographic groups most similar to Immigrants from Southern Europe are Syrian (5.5%, a difference of 0.010%), Immigrants from Hungary (5.5%, a difference of 0.10%), Immigrants from Sudan (5.5%, a difference of 0.15%), Costa Rican (5.5%, a difference of 0.18%), and Hawaiian (5.5%, a difference of 0.24%).
| Demographics | Rating | Rank | Unemployment Among Women with Children Under 18 years |
| Immigrants | Eastern Africa | 51.3 /100 | #173 | Average 5.4% |
| Immigrants | Uzbekistan | 50.0 /100 | #174 | Average 5.4% |
| Spanish | 49.0 /100 | #175 | Average 5.4% |
| Immigrants | Germany | 48.5 /100 | #176 | Average 5.5% |
| Hawaiians | 46.1 /100 | #177 | Average 5.5% |
| Costa Ricans | 45.2 /100 | #178 | Average 5.5% |
| Syrians | 42.8 /100 | #179 | Average 5.5% |
| Immigrants | Southern Europe | 42.7 /100 | #180 | Average 5.5% |
| Immigrants | Hungary | 41.3 /100 | #181 | Average 5.5% |
| Immigrants | Sudan | 40.6 /100 | #182 | Average 5.5% |
| Immigrants | Laos | 38.8 /100 | #183 | Fair 5.5% |
| Immigrants | Cambodia | 38.4 /100 | #184 | Fair 5.5% |
| Immigrants | Zaire | 38.1 /100 | #185 | Fair 5.5% |
| Indonesians | 36.3 /100 | #186 | Fair 5.5% |
| Malaysians | 35.7 /100 | #187 | Fair 5.5% |
Demographics Similar to Guyanese by Unemployment Among Women with Children Under 18 years
In terms of unemployment among women with children under 18 years, the demographic groups most similar to Guyanese are Ecuadorian (6.5%, a difference of 0.24%), Yaqui (6.6%, a difference of 0.30%), African (6.5%, a difference of 0.33%), Immigrants from Mexico (6.6%, a difference of 0.39%), and Belizean (6.5%, a difference of 0.55%).
| Demographics | Rating | Rank | Unemployment Among Women with Children Under 18 years |
| Immigrants | Honduras | 0.0 /100 | #303 | Tragic 6.5% |
| Vietnamese | 0.0 /100 | #304 | Tragic 6.5% |
| Immigrants | Central America | 0.0 /100 | #305 | Tragic 6.5% |
| Immigrants | Guyana | 0.0 /100 | #306 | Tragic 6.5% |
| Belizeans | 0.0 /100 | #307 | Tragic 6.5% |
| Africans | 0.0 /100 | #308 | Tragic 6.5% |
| Ecuadorians | 0.0 /100 | #309 | Tragic 6.5% |
| Guyanese | 0.0 /100 | #310 | Tragic 6.6% |
| Yaqui | 0.0 /100 | #311 | Tragic 6.6% |
| Immigrants | Mexico | 0.0 /100 | #312 | Tragic 6.6% |
| Hispanics or Latinos | 0.0 /100 | #313 | Tragic 6.6% |
| British West Indians | 0.0 /100 | #314 | Tragic 6.6% |
| Immigrants | West Indies | 0.0 /100 | #315 | Tragic 6.6% |
| Immigrants | Ecuador | 0.0 /100 | #316 | Tragic 6.6% |
| Shoshone | 0.0 /100 | #317 | Tragic 6.6% |