Immigrants from South Eastern Asia vs Sierra Leonean Unemployment Among Ages 16 to 19 years
COMPARE
Immigrants from South Eastern Asia
Sierra Leonean
Unemployment Among Ages 16 to 19 years
Unemployment Among Ages 16 to 19 years Comparison
Immigrants from South Eastern Asia
Sierra Leoneans
17.1%
UNEMPLOYMENT AMONG AGES 16 TO 19 YEARS
90.7/ 100
METRIC RATING
122nd/ 347
METRIC RANK
19.7%
UNEMPLOYMENT AMONG AGES 16 TO 19 YEARS
0.0/ 100
METRIC RATING
284th/ 347
METRIC RANK
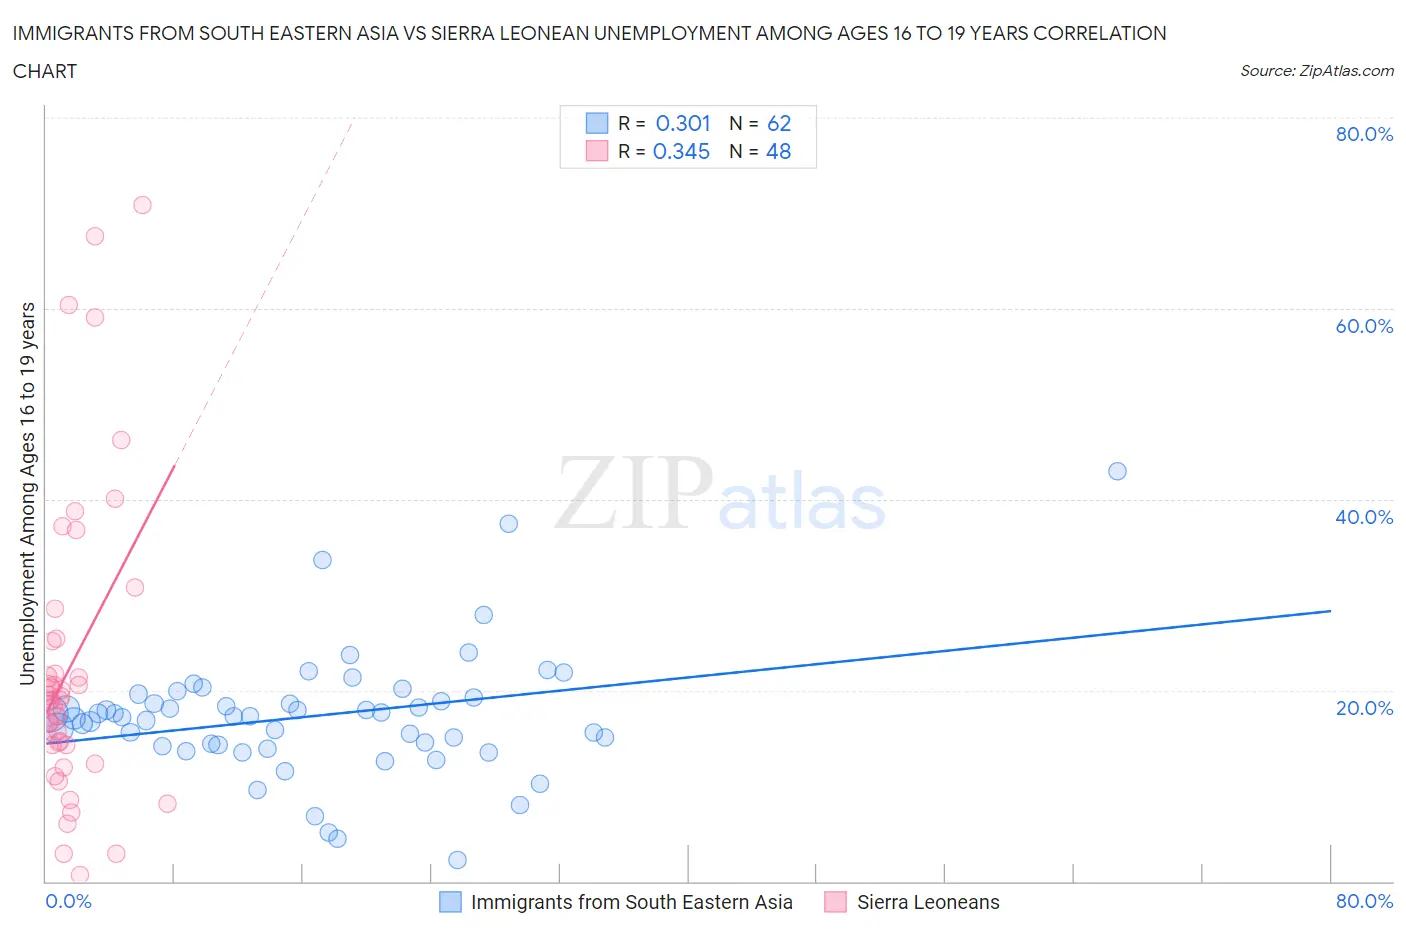
Immigrants from South Eastern Asia vs Sierra Leonean Unemployment Among Ages 16 to 19 years Correlation Chart
The statistical analysis conducted on geographies consisting of 473,939,844 people shows a mild positive correlation between the proportion of Immigrants from South Eastern Asia and unemployment rate among population between the ages 16 and 19 in the United States with a correlation coefficient (R) of 0.301 and weighted average of 17.1%. Similarly, the statistical analysis conducted on geographies consisting of 82,596,645 people shows a mild positive correlation between the proportion of Sierra Leoneans and unemployment rate among population between the ages 16 and 19 in the United States with a correlation coefficient (R) of 0.345 and weighted average of 19.7%, a difference of 15.3%.
Unemployment Among Ages 16 to 19 years Correlation Summary
| Measurement | Immigrants from South Eastern Asia | Sierra Leonean |
| Minimum | 2.2% | 0.60% |
| Maximum | 42.9% | 70.8% |
| Range | 40.7% | 70.2% |
| Mean | 17.3% | 22.6% |
| Median | 17.3% | 18.9% |
| Interquartile 25% (IQ1) | 14.2% | 14.3% |
| Interquartile 75% (IQ3) | 19.2% | 25.3% |
| Interquartile Range (IQR) | 5.0% | 11.1% |
| Standard Deviation (Sample) | 6.7% | 16.0% |
| Standard Deviation (Population) | 6.6% | 15.8% |
Similar Demographics by Unemployment Among Ages 16 to 19 years
Demographics Similar to Immigrants from South Eastern Asia by Unemployment Among Ages 16 to 19 years
In terms of unemployment among ages 16 to 19 years, the demographic groups most similar to Immigrants from South Eastern Asia are Immigrants from Moldova (17.1%, a difference of 0.010%), Immigrants from Middle Africa (17.1%, a difference of 0.030%), Hungarian (17.1%, a difference of 0.14%), Venezuelan (17.1%, a difference of 0.18%), and Immigrants from Sri Lanka (17.1%, a difference of 0.20%).
| Demographics | Rating | Rank | Unemployment Among Ages 16 to 19 years |
| Brazilians | 92.3 /100 | #115 | Exceptional 17.1% |
| Immigrants | Korea | 92.2 /100 | #116 | Exceptional 17.1% |
| Immigrants | Sri Lanka | 92.0 /100 | #117 | Exceptional 17.1% |
| Venezuelans | 91.8 /100 | #118 | Exceptional 17.1% |
| Hungarians | 91.6 /100 | #119 | Exceptional 17.1% |
| Immigrants | Middle Africa | 90.9 /100 | #120 | Exceptional 17.1% |
| Immigrants | Moldova | 90.7 /100 | #121 | Exceptional 17.1% |
| Immigrants | South Eastern Asia | 90.7 /100 | #122 | Exceptional 17.1% |
| Immigrants | Laos | 88.8 /100 | #123 | Excellent 17.1% |
| Syrians | 88.6 /100 | #124 | Excellent 17.1% |
| Immigrants | Germany | 87.7 /100 | #125 | Excellent 17.2% |
| Immigrants | Bolivia | 86.7 /100 | #126 | Excellent 17.2% |
| Pakistanis | 85.8 /100 | #127 | Excellent 17.2% |
| Australians | 85.6 /100 | #128 | Excellent 17.2% |
| Creek | 85.5 /100 | #129 | Excellent 17.2% |
Demographics Similar to Sierra Leoneans by Unemployment Among Ages 16 to 19 years
In terms of unemployment among ages 16 to 19 years, the demographic groups most similar to Sierra Leoneans are Sioux (19.7%, a difference of 0.010%), Dutch West Indian (19.7%, a difference of 0.060%), Ghanaian (19.8%, a difference of 0.18%), Bahamian (19.8%, a difference of 0.30%), and Immigrants from Ghana (19.8%, a difference of 0.37%).
| Demographics | Rating | Rank | Unemployment Among Ages 16 to 19 years |
| Immigrants | Western Africa | 0.0 /100 | #277 | Tragic 19.4% |
| Africans | 0.0 /100 | #278 | Tragic 19.5% |
| Ute | 0.0 /100 | #279 | Tragic 19.6% |
| Cajuns | 0.0 /100 | #280 | Tragic 19.6% |
| Cypriots | 0.0 /100 | #281 | Tragic 19.6% |
| Dutch West Indians | 0.0 /100 | #282 | Tragic 19.7% |
| Sioux | 0.0 /100 | #283 | Tragic 19.7% |
| Sierra Leoneans | 0.0 /100 | #284 | Tragic 19.7% |
| Ghanaians | 0.0 /100 | #285 | Tragic 19.8% |
| Bahamians | 0.0 /100 | #286 | Tragic 19.8% |
| Immigrants | Ghana | 0.0 /100 | #287 | Tragic 19.8% |
| Immigrants | Azores | 0.0 /100 | #288 | Tragic 19.8% |
| Pueblo | 0.0 /100 | #289 | Tragic 19.8% |
| Immigrants | Sierra Leone | 0.0 /100 | #290 | Tragic 20.0% |
| Immigrants | Yemen | 0.0 /100 | #291 | Tragic 20.0% |