Immigrants from South Eastern Asia vs Immigrants from England Unemployment Among Ages 45 to 54 years
COMPARE
Immigrants from South Eastern Asia
Immigrants from England
Unemployment Among Ages 45 to 54 years
Unemployment Among Ages 45 to 54 years Comparison
Immigrants from South Eastern Asia
Immigrants from England
4.5%
UNEMPLOYMENT AMONG AGES 45 TO 54 YEARS
62.0/ 100
METRIC RATING
160th/ 347
METRIC RANK
4.4%
UNEMPLOYMENT AMONG AGES 45 TO 54 YEARS
91.3/ 100
METRIC RATING
110th/ 347
METRIC RANK
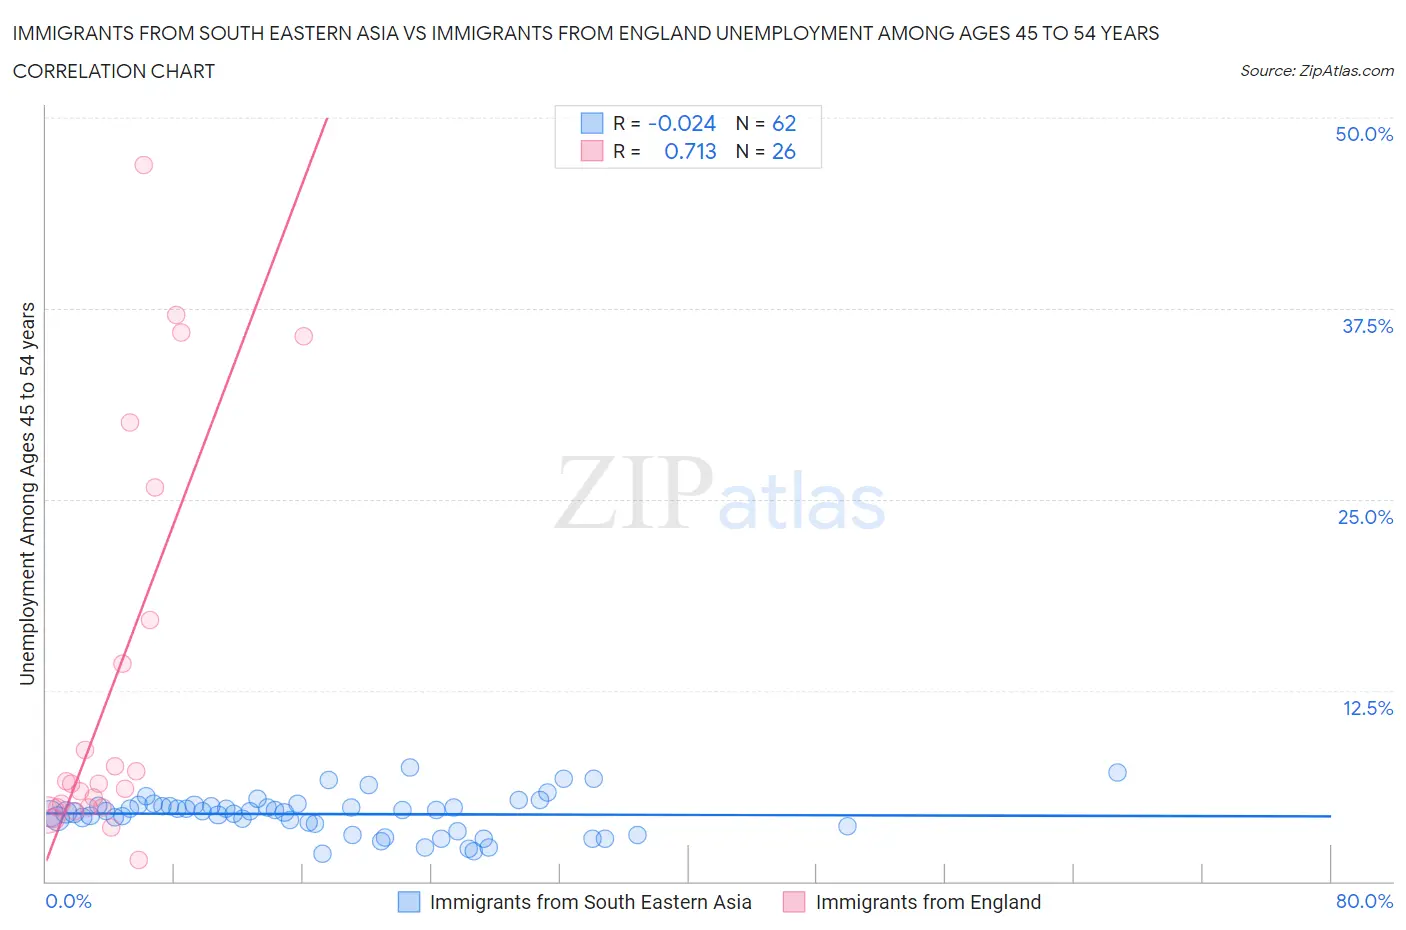
Immigrants from South Eastern Asia vs Immigrants from England Unemployment Among Ages 45 to 54 years Correlation Chart
The statistical analysis conducted on geographies consisting of 489,518,299 people shows no correlation between the proportion of Immigrants from South Eastern Asia and unemployment rate among population between the ages 45 and 54 in the United States with a correlation coefficient (R) of -0.024 and weighted average of 4.5%. Similarly, the statistical analysis conducted on geographies consisting of 381,390,957 people shows a strong positive correlation between the proportion of Immigrants from England and unemployment rate among population between the ages 45 and 54 in the United States with a correlation coefficient (R) of 0.713 and weighted average of 4.4%, a difference of 2.2%.
Unemployment Among Ages 45 to 54 years Correlation Summary
| Measurement | Immigrants from South Eastern Asia | Immigrants from England |
| Minimum | 1.8% | 1.4% |
| Maximum | 7.4% | 46.9% |
| Range | 5.6% | 45.5% |
| Mean | 4.4% | 13.1% |
| Median | 4.6% | 6.4% |
| Interquartile 25% (IQ1) | 3.8% | 4.8% |
| Interquartile 75% (IQ3) | 4.9% | 17.1% |
| Interquartile Range (IQR) | 1.2% | 12.3% |
| Standard Deviation (Sample) | 1.3% | 13.1% |
| Standard Deviation (Population) | 1.2% | 12.9% |
Similar Demographics by Unemployment Among Ages 45 to 54 years
Demographics Similar to Immigrants from South Eastern Asia by Unemployment Among Ages 45 to 54 years
In terms of unemployment among ages 45 to 54 years, the demographic groups most similar to Immigrants from South Eastern Asia are Immigrants from Eastern Europe (4.5%, a difference of 0.020%), Nonimmigrants (4.5%, a difference of 0.040%), Immigrants from Indonesia (4.5%, a difference of 0.080%), Bangladeshi (4.5%, a difference of 0.11%), and Samoan (4.5%, a difference of 0.17%).
| Demographics | Rating | Rank | Unemployment Among Ages 45 to 54 years |
| Hungarians | 73.0 /100 | #153 | Good 4.5% |
| Immigrants | Spain | 72.5 /100 | #154 | Good 4.5% |
| Marshallese | 70.6 /100 | #155 | Good 4.5% |
| Immigrants | Croatia | 69.6 /100 | #156 | Good 4.5% |
| Indians (Asian) | 68.1 /100 | #157 | Good 4.5% |
| Immigrants | Italy | 65.5 /100 | #158 | Good 4.5% |
| Immigrants | Nonimmigrants | 62.8 /100 | #159 | Good 4.5% |
| Immigrants | South Eastern Asia | 62.0 /100 | #160 | Good 4.5% |
| Immigrants | Eastern Europe | 61.6 /100 | #161 | Good 4.5% |
| Immigrants | Indonesia | 60.3 /100 | #162 | Good 4.5% |
| Bangladeshis | 59.7 /100 | #163 | Average 4.5% |
| Samoans | 58.5 /100 | #164 | Average 4.5% |
| Maltese | 57.9 /100 | #165 | Average 4.5% |
| Immigrants | Western Europe | 57.4 /100 | #166 | Average 4.5% |
| Immigrants | Brazil | 56.4 /100 | #167 | Average 4.5% |
Demographics Similar to Immigrants from England by Unemployment Among Ages 45 to 54 years
In terms of unemployment among ages 45 to 54 years, the demographic groups most similar to Immigrants from England are Immigrants from Nicaragua (4.4%, a difference of 0.010%), Immigrants from Saudi Arabia (4.4%, a difference of 0.040%), French Canadian (4.4%, a difference of 0.050%), Immigrants from Chile (4.4%, a difference of 0.070%), and Pakistani (4.4%, a difference of 0.090%).
| Demographics | Rating | Rank | Unemployment Among Ages 45 to 54 years |
| Icelanders | 93.5 /100 | #103 | Exceptional 4.4% |
| Immigrants | Sweden | 93.0 /100 | #104 | Exceptional 4.4% |
| Immigrants | Kenya | 92.8 /100 | #105 | Exceptional 4.4% |
| Iranians | 92.5 /100 | #106 | Exceptional 4.4% |
| Immigrants | South Africa | 92.5 /100 | #107 | Exceptional 4.4% |
| Russians | 92.1 /100 | #108 | Exceptional 4.4% |
| New Zealanders | 91.9 /100 | #109 | Exceptional 4.4% |
| Immigrants | England | 91.3 /100 | #110 | Exceptional 4.4% |
| Immigrants | Nicaragua | 91.3 /100 | #111 | Exceptional 4.4% |
| Immigrants | Saudi Arabia | 91.1 /100 | #112 | Exceptional 4.4% |
| French Canadians | 91.0 /100 | #113 | Exceptional 4.4% |
| Immigrants | Chile | 90.9 /100 | #114 | Exceptional 4.4% |
| Pakistanis | 90.7 /100 | #115 | Exceptional 4.4% |
| Immigrants | North Macedonia | 90.6 /100 | #116 | Exceptional 4.4% |
| South Africans | 90.4 /100 | #117 | Exceptional 4.4% |