Immigrants from South Eastern Asia vs Immigrants from Cuba Unemployment Among Youth under 25 years
COMPARE
Immigrants from South Eastern Asia
Immigrants from Cuba
Unemployment Among Youth under 25 years
Unemployment Among Youth under 25 years Comparison
Immigrants from South Eastern Asia
Immigrants from Cuba
11.6%
UNEMPLOYMENT AMONG YOUTH UNDER 25 YEARS
51.7/ 100
METRIC RATING
173rd/ 347
METRIC RANK
10.0%
UNEMPLOYMENT AMONG YOUTH UNDER 25 YEARS
100.0/ 100
METRIC RATING
2nd/ 347
METRIC RANK
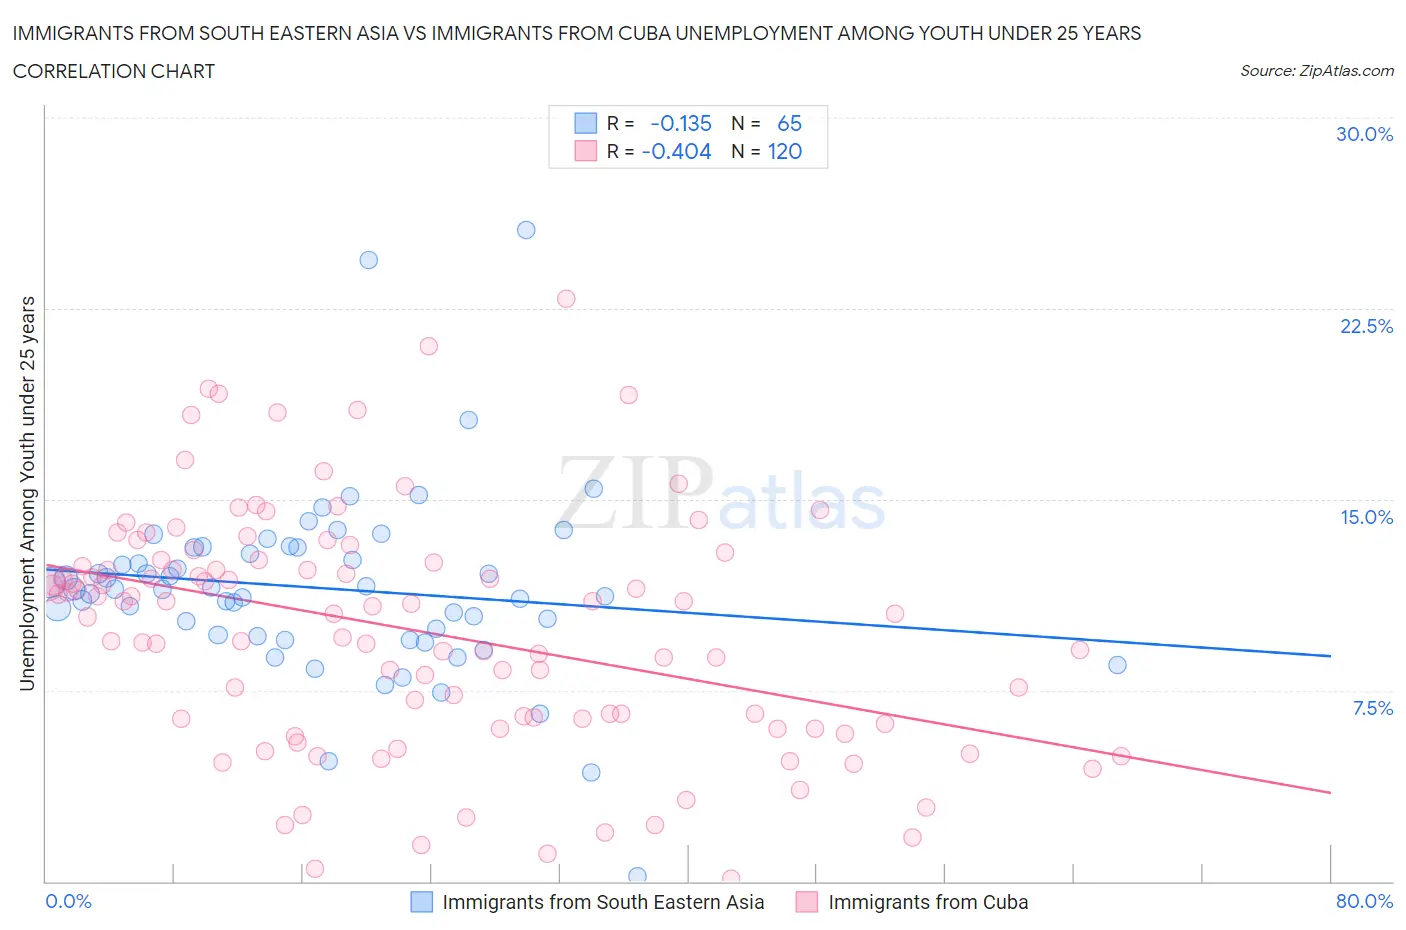
Immigrants from South Eastern Asia vs Immigrants from Cuba Unemployment Among Youth under 25 years Correlation Chart
The statistical analysis conducted on geographies consisting of 501,285,462 people shows a poor negative correlation between the proportion of Immigrants from South Eastern Asia and unemployment rate among youth under the age of 25 in the United States with a correlation coefficient (R) of -0.135 and weighted average of 11.6%. Similarly, the statistical analysis conducted on geographies consisting of 322,774,698 people shows a moderate negative correlation between the proportion of Immigrants from Cuba and unemployment rate among youth under the age of 25 in the United States with a correlation coefficient (R) of -0.404 and weighted average of 10.0%, a difference of 16.0%.
Unemployment Among Youth under 25 years Correlation Summary
| Measurement | Immigrants from South Eastern Asia | Immigrants from Cuba |
| Minimum | 0.20% | 0.10% |
| Maximum | 25.6% | 22.9% |
| Range | 25.4% | 22.8% |
| Mean | 11.5% | 9.9% |
| Median | 11.5% | 10.6% |
| Interquartile 25% (IQ1) | 9.6% | 6.3% |
| Interquartile 75% (IQ3) | 13.1% | 12.6% |
| Interquartile Range (IQR) | 3.5% | 6.3% |
| Standard Deviation (Sample) | 3.7% | 4.7% |
| Standard Deviation (Population) | 3.7% | 4.7% |
Similar Demographics by Unemployment Among Youth under 25 years
Demographics Similar to Immigrants from South Eastern Asia by Unemployment Among Youth under 25 years
In terms of unemployment among youth under 25 years, the demographic groups most similar to Immigrants from South Eastern Asia are Immigrants from China (11.6%, a difference of 0.070%), Immigrants from Morocco (11.6%, a difference of 0.14%), Bangladeshi (11.6%, a difference of 0.16%), Immigrants from Iraq (11.6%, a difference of 0.19%), and Russian (11.6%, a difference of 0.23%).
| Demographics | Rating | Rank | Unemployment Among Youth under 25 years |
| Spanish | 60.3 /100 | #166 | Good 11.6% |
| Okinawans | 58.7 /100 | #167 | Average 11.6% |
| Potawatomi | 57.9 /100 | #168 | Average 11.6% |
| Eastern Europeans | 57.5 /100 | #169 | Average 11.6% |
| Russians | 57.3 /100 | #170 | Average 11.6% |
| Bangladeshis | 55.6 /100 | #171 | Average 11.6% |
| Immigrants | Morocco | 55.1 /100 | #172 | Average 11.6% |
| Immigrants | South Eastern Asia | 51.7 /100 | #173 | Average 11.6% |
| Immigrants | China | 50.0 /100 | #174 | Average 11.6% |
| Immigrants | Iraq | 47.0 /100 | #175 | Average 11.6% |
| Ugandans | 45.6 /100 | #176 | Average 11.6% |
| Immigrants | Denmark | 45.0 /100 | #177 | Average 11.6% |
| Immigrants | Europe | 42.4 /100 | #178 | Average 11.6% |
| Immigrants | Hong Kong | 42.4 /100 | #179 | Average 11.6% |
| Spaniards | 39.8 /100 | #180 | Fair 11.7% |
Demographics Similar to Immigrants from Cuba by Unemployment Among Youth under 25 years
In terms of unemployment among youth under 25 years, the demographic groups most similar to Immigrants from Cuba are Luxembourger (10.0%, a difference of 0.28%), Norwegian (9.8%, a difference of 1.6%), Zimbabwean (10.2%, a difference of 1.9%), Czech (10.3%, a difference of 3.0%), and Danish (10.3%, a difference of 3.2%).
| Demographics | Rating | Rank | Unemployment Among Youth under 25 years |
| Norwegians | 100.0 /100 | #1 | Exceptional 9.8% |
| Immigrants | Cuba | 100.0 /100 | #2 | Exceptional 10.0% |
| Luxembourgers | 100.0 /100 | #3 | Exceptional 10.0% |
| Zimbabweans | 100.0 /100 | #4 | Exceptional 10.2% |
| Czechs | 100.0 /100 | #5 | Exceptional 10.3% |
| Danes | 100.0 /100 | #6 | Exceptional 10.3% |
| Swedes | 100.0 /100 | #7 | Exceptional 10.4% |
| Immigrants | Venezuela | 100.0 /100 | #8 | Exceptional 10.5% |
| Germans | 100.0 /100 | #9 | Exceptional 10.5% |
| Immigrants | Somalia | 100.0 /100 | #10 | Exceptional 10.5% |
| Scandinavians | 100.0 /100 | #11 | Exceptional 10.5% |
| Immigrants | Sudan | 100.0 /100 | #12 | Exceptional 10.5% |
| Indonesians | 100.0 /100 | #13 | Exceptional 10.6% |
| Cubans | 100.0 /100 | #14 | Exceptional 10.6% |
| Sudanese | 100.0 /100 | #15 | Exceptional 10.6% |