Immigrants from South Central Asia vs Luxembourger Unemployment Among Ages 16 to 19 years
COMPARE
Immigrants from South Central Asia
Luxembourger
Unemployment Among Ages 16 to 19 years
Unemployment Among Ages 16 to 19 years Comparison
Immigrants from South Central Asia
Luxembourgers
16.2%
UNEMPLOYMENT AMONG AGES 16 TO 19 YEARS
99.8/ 100
METRIC RATING
36th/ 347
METRIC RANK
15.1%
UNEMPLOYMENT AMONG AGES 16 TO 19 YEARS
100.0/ 100
METRIC RATING
3rd/ 347
METRIC RANK
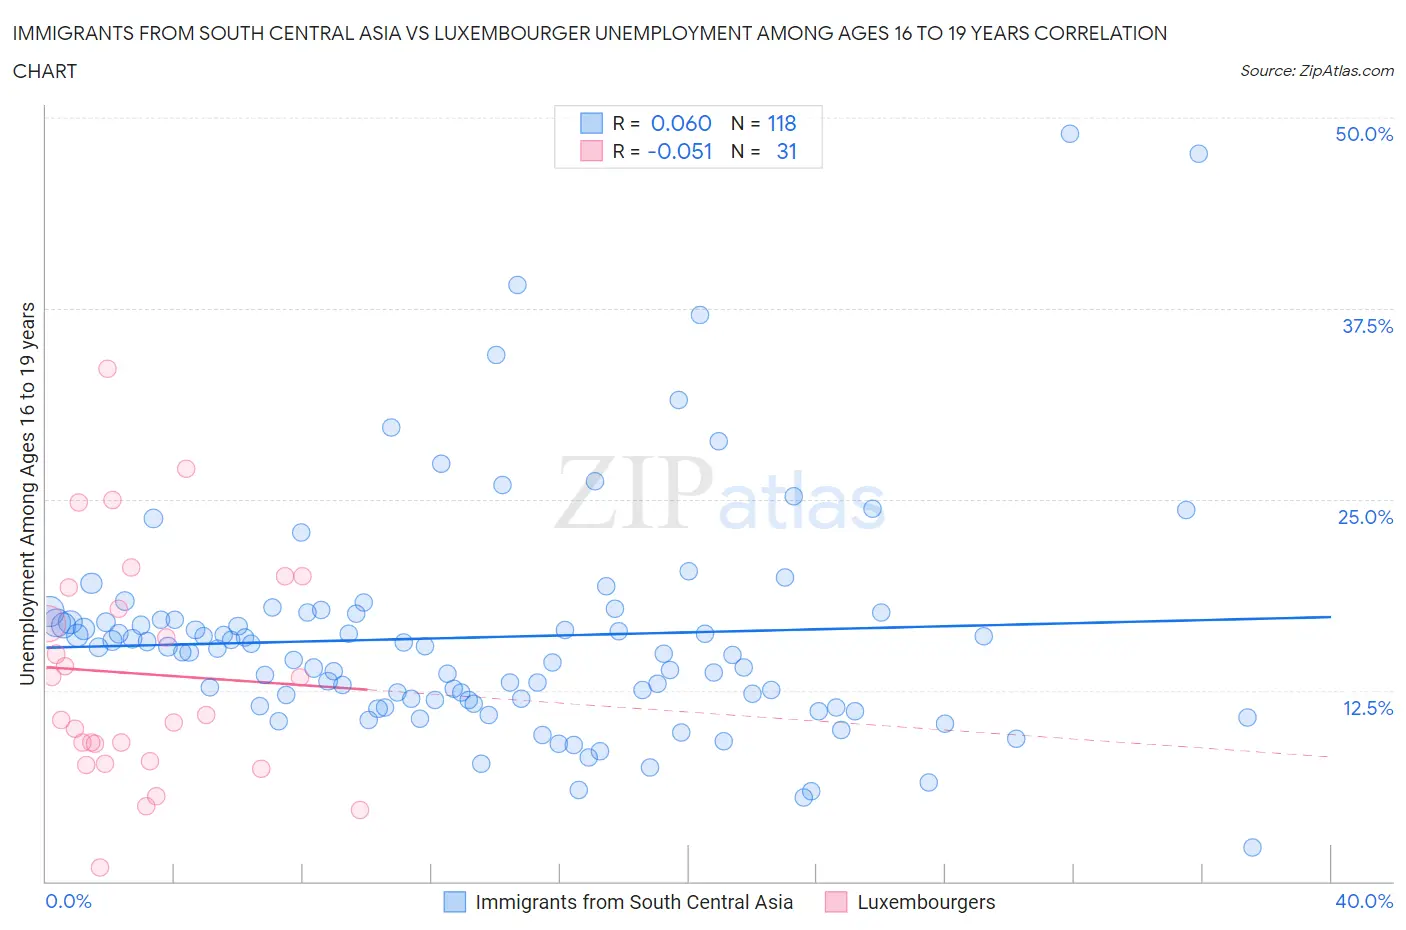
Immigrants from South Central Asia vs Luxembourger Unemployment Among Ages 16 to 19 years Correlation Chart
The statistical analysis conducted on geographies consisting of 443,198,264 people shows a slight positive correlation between the proportion of Immigrants from South Central Asia and unemployment rate among population between the ages 16 and 19 in the United States with a correlation coefficient (R) of 0.060 and weighted average of 16.2%. Similarly, the statistical analysis conducted on geographies consisting of 140,167,211 people shows a slight negative correlation between the proportion of Luxembourgers and unemployment rate among population between the ages 16 and 19 in the United States with a correlation coefficient (R) of -0.051 and weighted average of 15.1%, a difference of 7.8%.
Unemployment Among Ages 16 to 19 years Correlation Summary
| Measurement | Immigrants from South Central Asia | Luxembourger |
| Minimum | 2.2% | 0.90% |
| Maximum | 48.9% | 33.6% |
| Range | 46.7% | 32.7% |
| Mean | 16.0% | 13.6% |
| Median | 15.1% | 10.9% |
| Interquartile 25% (IQ1) | 11.9% | 7.9% |
| Interquartile 75% (IQ3) | 17.1% | 19.2% |
| Interquartile Range (IQR) | 5.3% | 11.3% |
| Standard Deviation (Sample) | 7.5% | 7.5% |
| Standard Deviation (Population) | 7.4% | 7.4% |
Similar Demographics by Unemployment Among Ages 16 to 19 years
Demographics Similar to Immigrants from South Central Asia by Unemployment Among Ages 16 to 19 years
In terms of unemployment among ages 16 to 19 years, the demographic groups most similar to Immigrants from South Central Asia are Scottish (16.2%, a difference of 0.010%), Immigrants from Congo (16.3%, a difference of 0.10%), Bulgarian (16.3%, a difference of 0.12%), Pennsylvania German (16.2%, a difference of 0.16%), and Immigrants from Kenya (16.2%, a difference of 0.19%).
| Demographics | Rating | Rank | Unemployment Among Ages 16 to 19 years |
| Chinese | 99.9 /100 | #29 | Exceptional 16.0% |
| Kenyans | 99.9 /100 | #30 | Exceptional 16.1% |
| English | 99.9 /100 | #31 | Exceptional 16.1% |
| Europeans | 99.9 /100 | #32 | Exceptional 16.1% |
| Immigrants | Kenya | 99.9 /100 | #33 | Exceptional 16.2% |
| Pennsylvania Germans | 99.9 /100 | #34 | Exceptional 16.2% |
| Scottish | 99.8 /100 | #35 | Exceptional 16.2% |
| Immigrants | South Central Asia | 99.8 /100 | #36 | Exceptional 16.2% |
| Immigrants | Congo | 99.8 /100 | #37 | Exceptional 16.3% |
| Bulgarians | 99.8 /100 | #38 | Exceptional 16.3% |
| Croatians | 99.8 /100 | #39 | Exceptional 16.3% |
| Hmong | 99.8 /100 | #40 | Exceptional 16.3% |
| Immigrants | Nepal | 99.8 /100 | #41 | Exceptional 16.3% |
| Fijians | 99.8 /100 | #42 | Exceptional 16.3% |
| Immigrants | Lebanon | 99.8 /100 | #43 | Exceptional 16.3% |
Demographics Similar to Luxembourgers by Unemployment Among Ages 16 to 19 years
In terms of unemployment among ages 16 to 19 years, the demographic groups most similar to Luxembourgers are Immigrants from India (15.0%, a difference of 0.42%), Danish (15.2%, a difference of 0.75%), Immigrants from Somalia (15.3%, a difference of 1.4%), Swedish (15.3%, a difference of 1.6%), and Immigrants from Bosnia and Herzegovina (15.3%, a difference of 1.8%).
| Demographics | Rating | Rank | Unemployment Among Ages 16 to 19 years |
| Norwegians | 100.0 /100 | #1 | Exceptional 14.5% |
| Immigrants | India | 100.0 /100 | #2 | Exceptional 15.0% |
| Luxembourgers | 100.0 /100 | #3 | Exceptional 15.1% |
| Danes | 100.0 /100 | #4 | Exceptional 15.2% |
| Immigrants | Somalia | 100.0 /100 | #5 | Exceptional 15.3% |
| Swedes | 100.0 /100 | #6 | Exceptional 15.3% |
| Immigrants | Bosnia and Herzegovina | 100.0 /100 | #7 | Exceptional 15.3% |
| Czechs | 100.0 /100 | #8 | Exceptional 15.4% |
| Scandinavians | 100.0 /100 | #9 | Exceptional 15.4% |
| Zimbabweans | 100.0 /100 | #10 | Exceptional 15.4% |
| Indonesians | 100.0 /100 | #11 | Exceptional 15.5% |
| Taiwanese | 100.0 /100 | #12 | Exceptional 15.5% |
| Immigrants | Burma/Myanmar | 100.0 /100 | #13 | Exceptional 15.6% |
| Immigrants | Zaire | 100.0 /100 | #14 | Exceptional 15.6% |
| Yugoslavians | 100.0 /100 | #15 | Exceptional 15.6% |