Immigrants from South Central Asia vs Immigrants from Lebanon Unemployment Among Ages 25 to 29 years
COMPARE
Immigrants from South Central Asia
Immigrants from Lebanon
Unemployment Among Ages 25 to 29 years
Unemployment Among Ages 25 to 29 years Comparison
Immigrants from South Central Asia
Immigrants from Lebanon
6.1%
UNEMPLOYMENT AMONG AGES 25 TO 29 YEARS
99.7/ 100
METRIC RATING
29th/ 347
METRIC RANK
6.3%
UNEMPLOYMENT AMONG AGES 25 TO 29 YEARS
97.8/ 100
METRIC RATING
65th/ 347
METRIC RANK
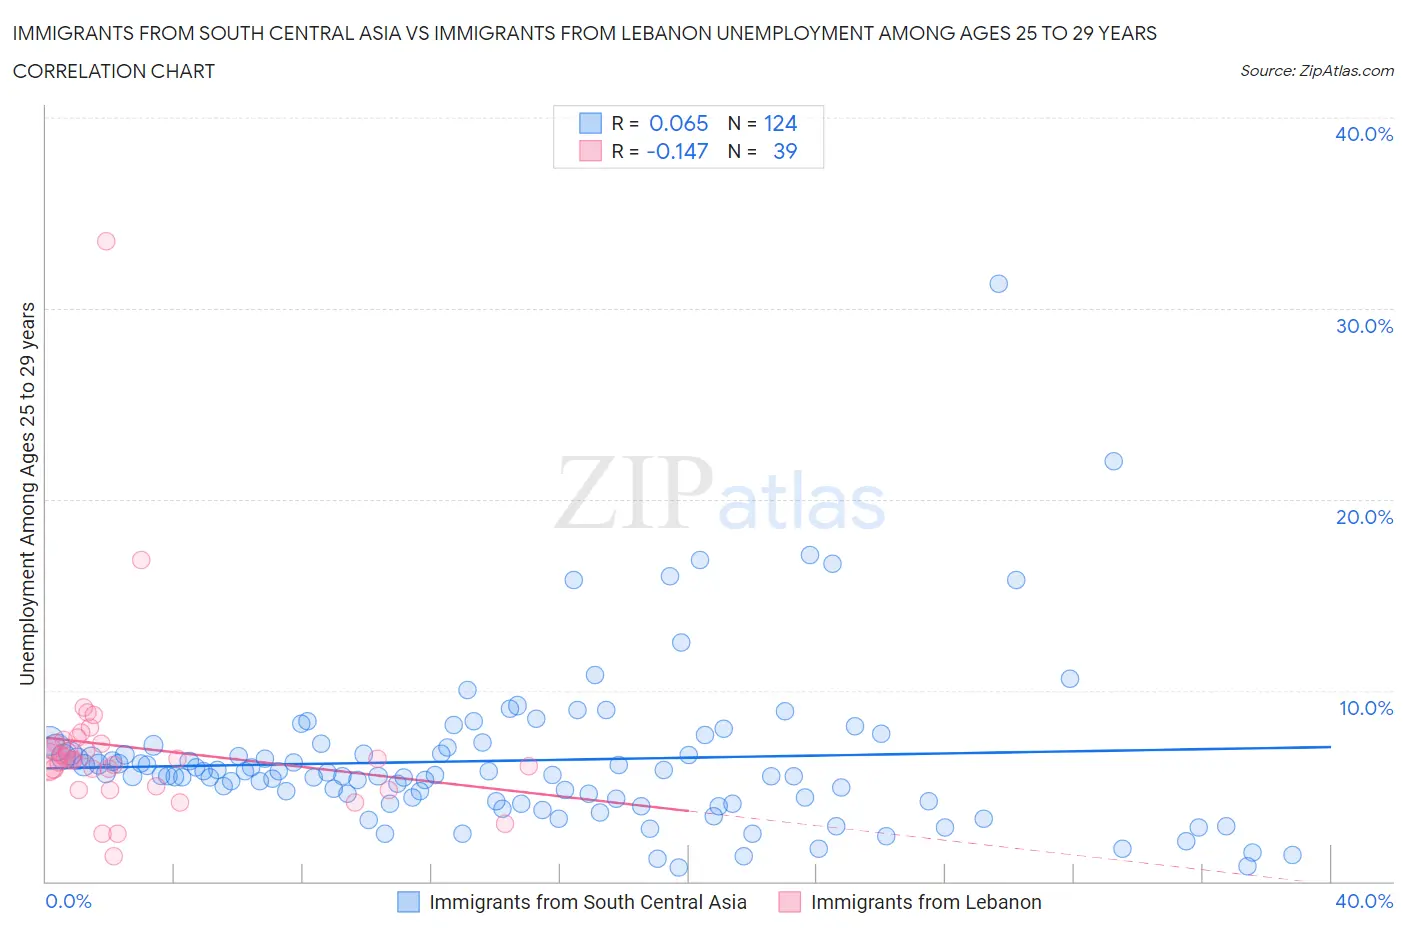
Immigrants from South Central Asia vs Immigrants from Lebanon Unemployment Among Ages 25 to 29 years Correlation Chart
The statistical analysis conducted on geographies consisting of 443,989,812 people shows a slight positive correlation between the proportion of Immigrants from South Central Asia and unemployment rate among population between the ages 25 and 29 in the United States with a correlation coefficient (R) of 0.065 and weighted average of 6.1%. Similarly, the statistical analysis conducted on geographies consisting of 211,557,683 people shows a poor negative correlation between the proportion of Immigrants from Lebanon and unemployment rate among population between the ages 25 and 29 in the United States with a correlation coefficient (R) of -0.147 and weighted average of 6.3%, a difference of 3.4%.
Unemployment Among Ages 25 to 29 years Correlation Summary
| Measurement | Immigrants from South Central Asia | Immigrants from Lebanon |
| Minimum | 0.70% | 1.3% |
| Maximum | 31.3% | 33.5% |
| Range | 30.6% | 32.2% |
| Mean | 6.3% | 7.0% |
| Median | 5.6% | 6.4% |
| Interquartile 25% (IQ1) | 4.2% | 5.0% |
| Interquartile 75% (IQ3) | 7.0% | 7.2% |
| Interquartile Range (IQR) | 2.8% | 2.2% |
| Standard Deviation (Sample) | 4.2% | 5.0% |
| Standard Deviation (Population) | 4.1% | 4.9% |
Similar Demographics by Unemployment Among Ages 25 to 29 years
Demographics Similar to Immigrants from South Central Asia by Unemployment Among Ages 25 to 29 years
In terms of unemployment among ages 25 to 29 years, the demographic groups most similar to Immigrants from South Central Asia are Bulgarian (6.1%, a difference of 0.11%), Danish (6.0%, a difference of 0.18%), Filipino (6.1%, a difference of 0.20%), Immigrants from Zaire (6.0%, a difference of 0.23%), and Immigrants from Eastern Africa (6.0%, a difference of 0.35%).
| Demographics | Rating | Rank | Unemployment Among Ages 25 to 29 years |
| Immigrants | Japan | 99.9 /100 | #22 | Exceptional 6.0% |
| Immigrants | Venezuela | 99.8 /100 | #23 | Exceptional 6.0% |
| Norwegians | 99.8 /100 | #24 | Exceptional 6.0% |
| New Zealanders | 99.8 /100 | #25 | Exceptional 6.0% |
| Immigrants | Eastern Africa | 99.8 /100 | #26 | Exceptional 6.0% |
| Immigrants | Zaire | 99.7 /100 | #27 | Exceptional 6.0% |
| Danes | 99.7 /100 | #28 | Exceptional 6.0% |
| Immigrants | South Central Asia | 99.7 /100 | #29 | Exceptional 6.1% |
| Bulgarians | 99.7 /100 | #30 | Exceptional 6.1% |
| Filipinos | 99.7 /100 | #31 | Exceptional 6.1% |
| Chinese | 99.6 /100 | #32 | Exceptional 6.1% |
| Yugoslavians | 99.6 /100 | #33 | Exceptional 6.1% |
| Immigrants | Morocco | 99.5 /100 | #34 | Exceptional 6.1% |
| Immigrants | Zimbabwe | 99.5 /100 | #35 | Exceptional 6.1% |
| Taiwanese | 99.5 /100 | #36 | Exceptional 6.1% |
Demographics Similar to Immigrants from Lebanon by Unemployment Among Ages 25 to 29 years
In terms of unemployment among ages 25 to 29 years, the demographic groups most similar to Immigrants from Lebanon are Indian (Asian) (6.3%, a difference of 0.020%), Immigrants from Northern Africa (6.3%, a difference of 0.030%), Immigrants from Sri Lanka (6.3%, a difference of 0.060%), Palestinian (6.3%, a difference of 0.070%), and Kenyan (6.3%, a difference of 0.10%).
| Demographics | Rating | Rank | Unemployment Among Ages 25 to 29 years |
| Immigrants | Eastern Asia | 98.4 /100 | #58 | Exceptional 6.2% |
| Luxembourgers | 98.3 /100 | #59 | Exceptional 6.2% |
| Immigrants | Taiwan | 98.3 /100 | #60 | Exceptional 6.2% |
| Bhutanese | 98.2 /100 | #61 | Exceptional 6.2% |
| Immigrants | China | 98.1 /100 | #62 | Exceptional 6.2% |
| Kenyans | 98.0 /100 | #63 | Exceptional 6.3% |
| Immigrants | Sri Lanka | 97.9 /100 | #64 | Exceptional 6.3% |
| Immigrants | Lebanon | 97.8 /100 | #65 | Exceptional 6.3% |
| Indians (Asian) | 97.8 /100 | #66 | Exceptional 6.3% |
| Immigrants | Northern Africa | 97.8 /100 | #67 | Exceptional 6.3% |
| Palestinians | 97.7 /100 | #68 | Exceptional 6.3% |
| Immigrants | Hong Kong | 97.5 /100 | #69 | Exceptional 6.3% |
| Immigrants | Malaysia | 97.5 /100 | #70 | Exceptional 6.3% |
| Immigrants | France | 97.4 /100 | #71 | Exceptional 6.3% |
| Scandinavians | 97.4 /100 | #72 | Exceptional 6.3% |