Immigrants from South Central Asia vs Immigrants from Denmark Unemployment Among Seniors over 75 years
COMPARE
Immigrants from South Central Asia
Immigrants from Denmark
Unemployment Among Seniors over 75 years
Unemployment Among Seniors over 75 years Comparison
Immigrants from South Central Asia
Immigrants from Denmark
8.2%
UNEMPLOYMENT AMONG SENIORS OVER 75 YEARS
99.0/ 100
METRIC RATING
104th/ 347
METRIC RANK
7.8%
UNEMPLOYMENT AMONG SENIORS OVER 75 YEARS
100.0/ 100
METRIC RATING
43rd/ 347
METRIC RANK
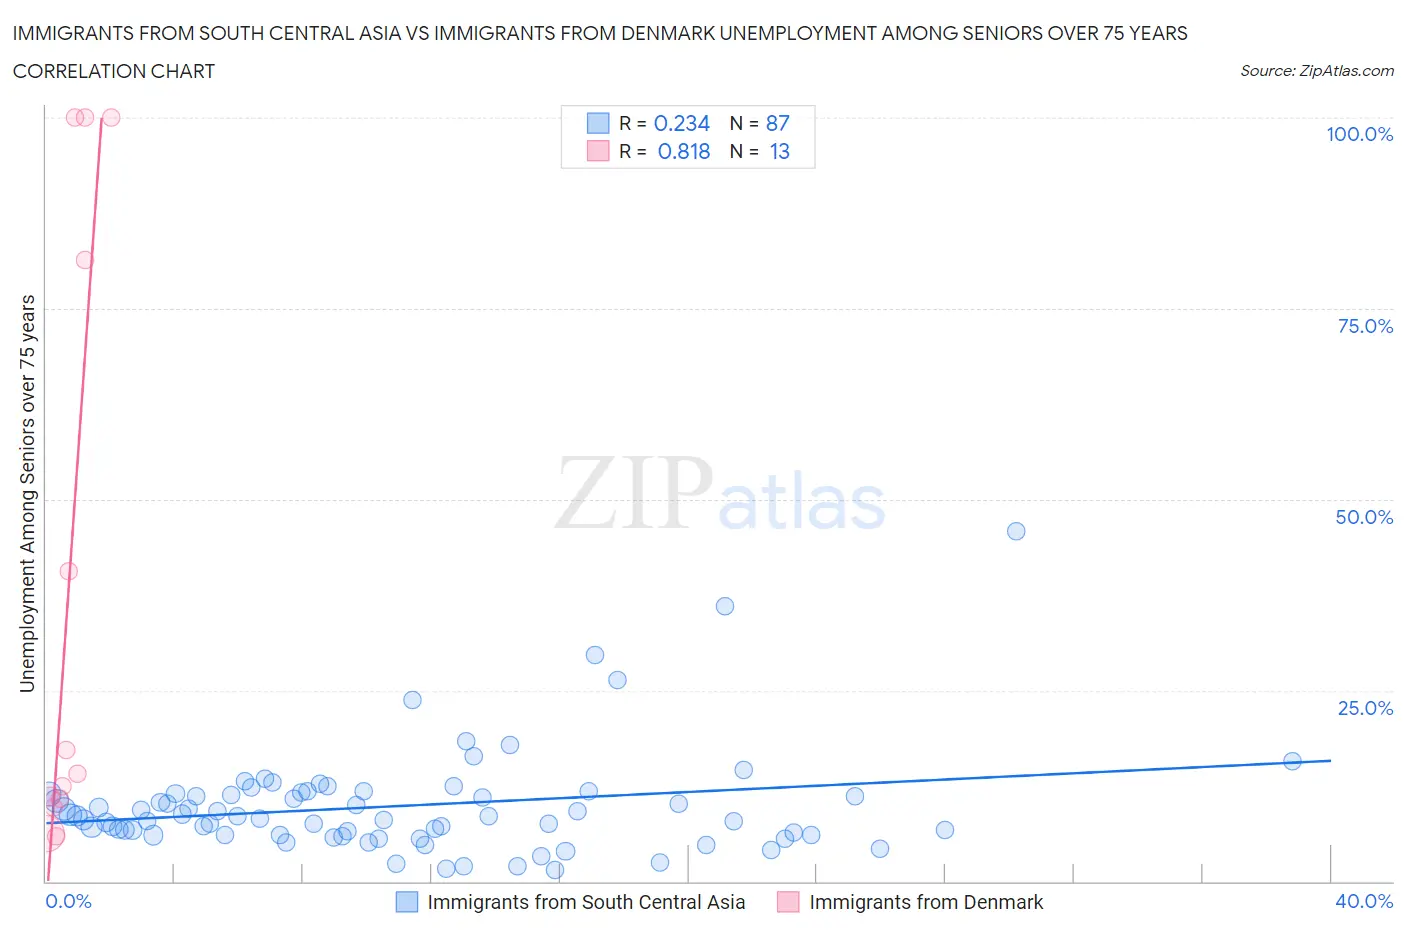
Immigrants from South Central Asia vs Immigrants from Denmark Unemployment Among Seniors over 75 years Correlation Chart
The statistical analysis conducted on geographies consisting of 222,090,322 people shows a weak positive correlation between the proportion of Immigrants from South Central Asia and unemployment rate among seniors over the age of 75 in the United States with a correlation coefficient (R) of 0.234 and weighted average of 8.2%. Similarly, the statistical analysis conducted on geographies consisting of 98,267,955 people shows a very strong positive correlation between the proportion of Immigrants from Denmark and unemployment rate among seniors over the age of 75 in the United States with a correlation coefficient (R) of 0.818 and weighted average of 7.8%, a difference of 5.7%.
Unemployment Among Seniors over 75 years Correlation Summary
| Measurement | Immigrants from South Central Asia | Immigrants from Denmark |
| Minimum | 1.4% | 5.8% |
| Maximum | 45.9% | 100.0% |
| Range | 44.5% | 94.2% |
| Mean | 9.8% | 39.1% |
| Median | 8.5% | 14.0% |
| Interquartile 25% (IQ1) | 6.1% | 10.2% |
| Interquartile 75% (IQ3) | 11.5% | 90.7% |
| Interquartile Range (IQR) | 5.4% | 80.4% |
| Standard Deviation (Sample) | 6.9% | 40.2% |
| Standard Deviation (Population) | 6.8% | 38.6% |
Similar Demographics by Unemployment Among Seniors over 75 years
Demographics Similar to Immigrants from South Central Asia by Unemployment Among Seniors over 75 years
In terms of unemployment among seniors over 75 years, the demographic groups most similar to Immigrants from South Central Asia are Immigrants from Caribbean (8.2%, a difference of 0.020%), Immigrants from Honduras (8.2%, a difference of 0.020%), South American Indian (8.2%, a difference of 0.030%), Immigrants from Panama (8.2%, a difference of 0.18%), and Sri Lankan (8.2%, a difference of 0.19%).
| Demographics | Rating | Rank | Unemployment Among Seniors over 75 years |
| Immigrants | Sri Lanka | 99.3 /100 | #97 | Exceptional 8.2% |
| Immigrants | Northern Africa | 99.3 /100 | #98 | Exceptional 8.2% |
| Burmese | 99.2 /100 | #99 | Exceptional 8.2% |
| Immigrants | Kazakhstan | 99.2 /100 | #100 | Exceptional 8.2% |
| Immigrants | Serbia | 99.2 /100 | #101 | Exceptional 8.2% |
| Immigrants | Panama | 99.1 /100 | #102 | Exceptional 8.2% |
| South American Indians | 99.1 /100 | #103 | Exceptional 8.2% |
| Immigrants | South Central Asia | 99.0 /100 | #104 | Exceptional 8.2% |
| Immigrants | Caribbean | 99.0 /100 | #105 | Exceptional 8.2% |
| Immigrants | Honduras | 99.0 /100 | #106 | Exceptional 8.2% |
| Sri Lankans | 98.9 /100 | #107 | Exceptional 8.2% |
| Laotians | 98.8 /100 | #108 | Exceptional 8.2% |
| Immigrants | Lebanon | 98.8 /100 | #109 | Exceptional 8.2% |
| Marshallese | 98.7 /100 | #110 | Exceptional 8.2% |
| French American Indians | 98.7 /100 | #111 | Exceptional 8.2% |
Demographics Similar to Immigrants from Denmark by Unemployment Among Seniors over 75 years
In terms of unemployment among seniors over 75 years, the demographic groups most similar to Immigrants from Denmark are Immigrants from Spain (7.8%, a difference of 0.040%), British West Indian (7.8%, a difference of 0.050%), Immigrants from China (7.8%, a difference of 0.11%), Pueblo (7.7%, a difference of 0.30%), and Creek (7.8%, a difference of 0.52%).
| Demographics | Rating | Rank | Unemployment Among Seniors over 75 years |
| Luxembourgers | 100.0 /100 | #36 | Exceptional 7.7% |
| Immigrants | Hungary | 100.0 /100 | #37 | Exceptional 7.7% |
| Kiowa | 100.0 /100 | #38 | Exceptional 7.7% |
| Ugandans | 100.0 /100 | #39 | Exceptional 7.7% |
| Colville | 100.0 /100 | #40 | Exceptional 7.7% |
| Immigrants | Burma/Myanmar | 100.0 /100 | #41 | Exceptional 7.7% |
| Pueblo | 100.0 /100 | #42 | Exceptional 7.7% |
| Immigrants | Denmark | 100.0 /100 | #43 | Exceptional 7.8% |
| Immigrants | Spain | 100.0 /100 | #44 | Exceptional 7.8% |
| British West Indians | 100.0 /100 | #45 | Exceptional 7.8% |
| Immigrants | China | 100.0 /100 | #46 | Exceptional 7.8% |
| Creek | 100.0 /100 | #47 | Exceptional 7.8% |
| Immigrants | Chile | 100.0 /100 | #48 | Exceptional 7.8% |
| Potawatomi | 100.0 /100 | #49 | Exceptional 7.8% |
| Immigrants | Latvia | 100.0 /100 | #50 | Exceptional 7.8% |