Immigrants from South America vs Immigrants from Iraq Unemployment Among Ages 65 to 74 years
COMPARE
Immigrants from South America
Immigrants from Iraq
Unemployment Among Ages 65 to 74 years
Unemployment Among Ages 65 to 74 years Comparison
Immigrants from South America
Immigrants from Iraq
5.7%
UNEMPLOYMENT AMONG AGES 65 TO 74 YEARS
0.1/ 100
METRIC RATING
277th/ 347
METRIC RANK
5.1%
UNEMPLOYMENT AMONG AGES 65 TO 74 YEARS
99.9/ 100
METRIC RATING
40th/ 347
METRIC RANK
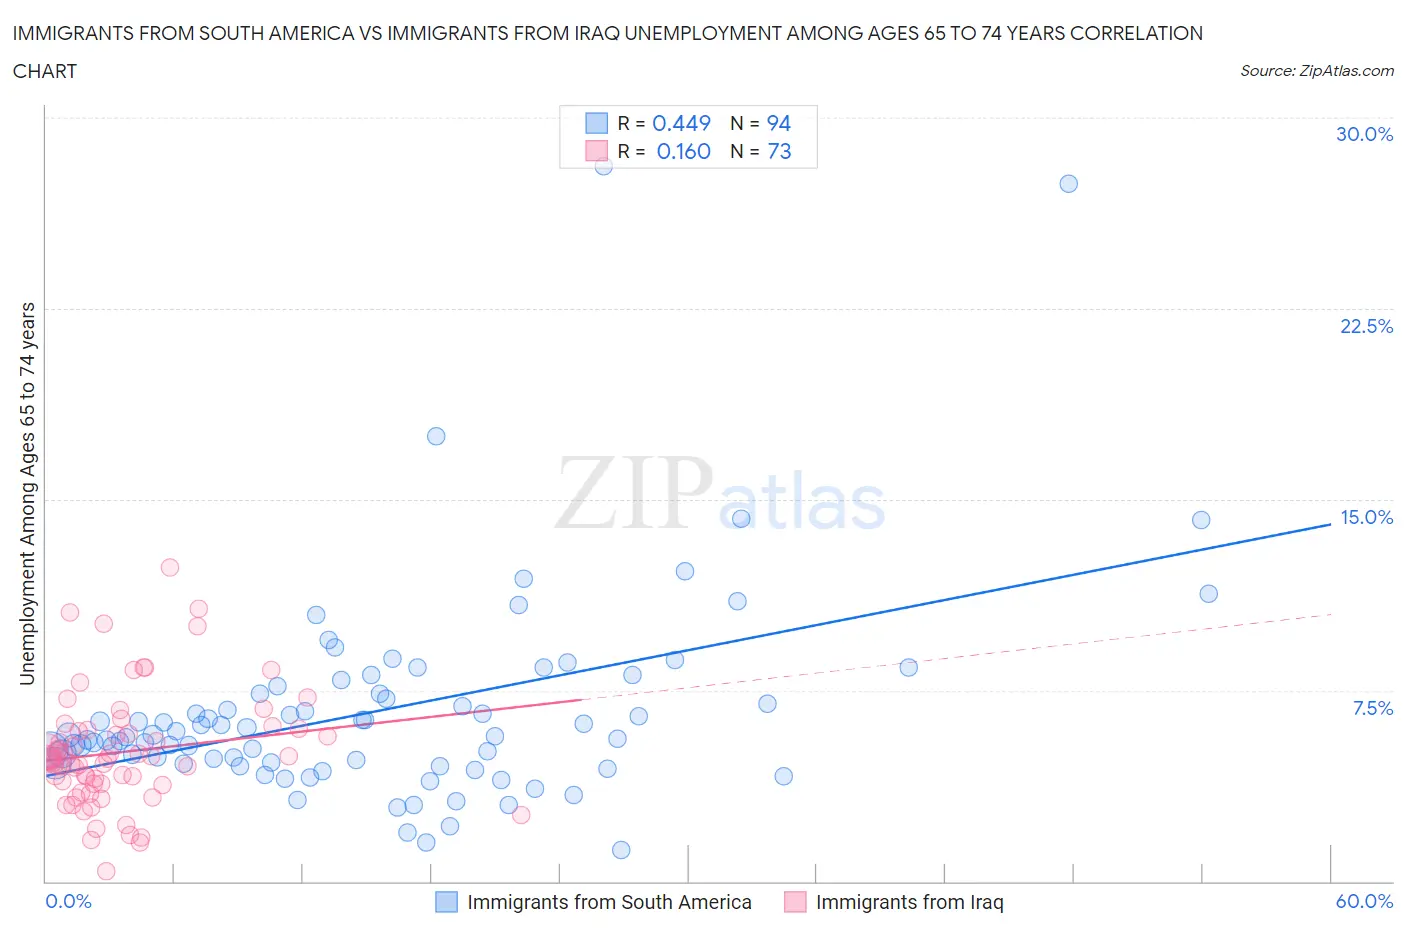
Immigrants from South America vs Immigrants from Iraq Unemployment Among Ages 65 to 74 years Correlation Chart
The statistical analysis conducted on geographies consisting of 412,151,558 people shows a moderate positive correlation between the proportion of Immigrants from South America and unemployment rate among population between the ages 65 and 74 in the United States with a correlation coefficient (R) of 0.449 and weighted average of 5.7%. Similarly, the statistical analysis conducted on geographies consisting of 183,665,160 people shows a poor positive correlation between the proportion of Immigrants from Iraq and unemployment rate among population between the ages 65 and 74 in the United States with a correlation coefficient (R) of 0.160 and weighted average of 5.1%, a difference of 12.4%.
Unemployment Among Ages 65 to 74 years Correlation Summary
| Measurement | Immigrants from South America | Immigrants from Iraq |
| Minimum | 1.2% | 0.40% |
| Maximum | 28.1% | 12.3% |
| Range | 26.9% | 11.9% |
| Mean | 6.7% | 5.1% |
| Median | 5.7% | 4.8% |
| Interquartile 25% (IQ1) | 4.6% | 3.8% |
| Interquartile 75% (IQ3) | 7.4% | 6.0% |
| Interquartile Range (IQR) | 2.7% | 2.2% |
| Standard Deviation (Sample) | 4.2% | 2.3% |
| Standard Deviation (Population) | 4.1% | 2.3% |
Similar Demographics by Unemployment Among Ages 65 to 74 years
Demographics Similar to Immigrants from South America by Unemployment Among Ages 65 to 74 years
In terms of unemployment among ages 65 to 74 years, the demographic groups most similar to Immigrants from South America are Mexican American Indian (5.7%, a difference of 0.020%), Somali (5.7%, a difference of 0.17%), Immigrants from Norway (5.7%, a difference of 0.18%), Moroccan (5.7%, a difference of 0.18%), and Immigrants from Liberia (5.7%, a difference of 0.22%).
| Demographics | Rating | Rank | Unemployment Among Ages 65 to 74 years |
| Immigrants | Nigeria | 0.1 /100 | #270 | Tragic 5.7% |
| Belizeans | 0.1 /100 | #271 | Tragic 5.7% |
| Yaqui | 0.1 /100 | #272 | Tragic 5.7% |
| Bahamians | 0.1 /100 | #273 | Tragic 5.7% |
| Immigrants | Guyana | 0.1 /100 | #274 | Tragic 5.7% |
| Immigrants | Liberia | 0.1 /100 | #275 | Tragic 5.7% |
| Somalis | 0.1 /100 | #276 | Tragic 5.7% |
| Immigrants | South America | 0.1 /100 | #277 | Tragic 5.7% |
| Mexican American Indians | 0.1 /100 | #278 | Tragic 5.7% |
| Immigrants | Norway | 0.1 /100 | #279 | Tragic 5.7% |
| Moroccans | 0.1 /100 | #280 | Tragic 5.7% |
| Immigrants | West Indies | 0.1 /100 | #281 | Tragic 5.7% |
| Ottawa | 0.1 /100 | #282 | Tragic 5.7% |
| Cypriots | 0.1 /100 | #283 | Tragic 5.7% |
| Chippewa | 0.1 /100 | #284 | Tragic 5.7% |
Demographics Similar to Immigrants from Iraq by Unemployment Among Ages 65 to 74 years
In terms of unemployment among ages 65 to 74 years, the demographic groups most similar to Immigrants from Iraq are Ugandan (5.1%, a difference of 0.010%), Jordanian (5.1%, a difference of 0.16%), Immigrants from Sweden (5.0%, a difference of 0.17%), Nepalese (5.0%, a difference of 0.19%), and Assyrian/Chaldean/Syriac (5.1%, a difference of 0.28%).
| Demographics | Rating | Rank | Unemployment Among Ages 65 to 74 years |
| Belgians | 100.0 /100 | #33 | Exceptional 5.0% |
| Cambodians | 100.0 /100 | #34 | Exceptional 5.0% |
| Bhutanese | 100.0 /100 | #35 | Exceptional 5.0% |
| Immigrants | Kuwait | 99.9 /100 | #36 | Exceptional 5.0% |
| Immigrants | Eastern Africa | 99.9 /100 | #37 | Exceptional 5.0% |
| Nepalese | 99.9 /100 | #38 | Exceptional 5.0% |
| Immigrants | Sweden | 99.9 /100 | #39 | Exceptional 5.0% |
| Immigrants | Iraq | 99.9 /100 | #40 | Exceptional 5.1% |
| Ugandans | 99.9 /100 | #41 | Exceptional 5.1% |
| Jordanians | 99.9 /100 | #42 | Exceptional 5.1% |
| Assyrians/Chaldeans/Syriacs | 99.9 /100 | #43 | Exceptional 5.1% |
| Immigrants | India | 99.9 /100 | #44 | Exceptional 5.1% |
| Sioux | 99.8 /100 | #45 | Exceptional 5.1% |
| Immigrants | Kenya | 99.8 /100 | #46 | Exceptional 5.1% |
| Immigrants | Uganda | 99.8 /100 | #47 | Exceptional 5.1% |