Immigrants from South America vs Immigrants from Guatemala Unemployment Among Seniors over 75 years
COMPARE
Immigrants from South America
Immigrants from Guatemala
Unemployment Among Seniors over 75 years
Unemployment Among Seniors over 75 years Comparison
Immigrants from South America
Immigrants from Guatemala
8.6%
UNEMPLOYMENT AMONG SENIORS OVER 75 YEARS
71.3/ 100
METRIC RATING
162nd/ 347
METRIC RANK
8.7%
UNEMPLOYMENT AMONG SENIORS OVER 75 YEARS
68.4/ 100
METRIC RATING
163rd/ 347
METRIC RANK
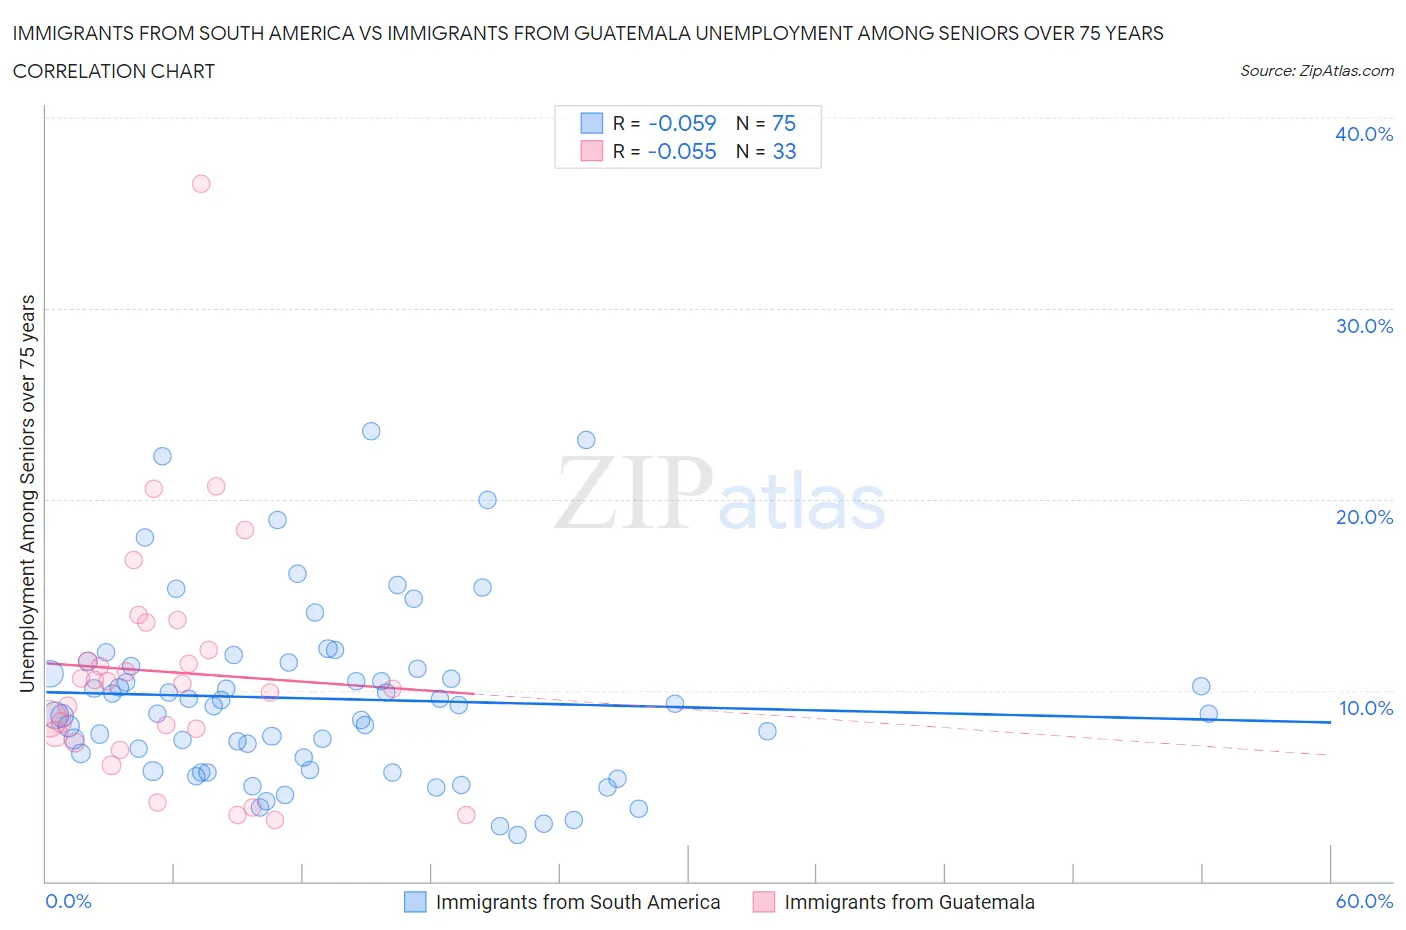
Immigrants from South America vs Immigrants from Guatemala Unemployment Among Seniors over 75 years Correlation Chart
The statistical analysis conducted on geographies consisting of 224,227,019 people shows a slight negative correlation between the proportion of Immigrants from South America and unemployment rate among seniors over the age of 75 in the United States with a correlation coefficient (R) of -0.059 and weighted average of 8.6%. Similarly, the statistical analysis conducted on geographies consisting of 194,202,123 people shows a slight negative correlation between the proportion of Immigrants from Guatemala and unemployment rate among seniors over the age of 75 in the United States with a correlation coefficient (R) of -0.055 and weighted average of 8.7%, a difference of 0.19%.
Unemployment Among Seniors over 75 years Correlation Summary
| Measurement | Immigrants from South America | Immigrants from Guatemala |
| Minimum | 2.4% | 3.2% |
| Maximum | 23.6% | 36.5% |
| Range | 21.2% | 33.3% |
| Mean | 9.6% | 11.0% |
| Median | 9.2% | 10.4% |
| Interquartile 25% (IQ1) | 5.8% | 7.5% |
| Interquartile 75% (IQ3) | 11.3% | 12.9% |
| Interquartile Range (IQR) | 5.5% | 5.4% |
| Standard Deviation (Sample) | 4.7% | 6.4% |
| Standard Deviation (Population) | 4.6% | 6.3% |
Demographics Similar to Immigrants from South America and Immigrants from Guatemala by Unemployment Among Seniors over 75 years
In terms of unemployment among seniors over 75 years, the demographic groups most similar to Immigrants from South America are Cree (8.6%, a difference of 0.10%), Albanian (8.6%, a difference of 0.10%), Shoshone (8.6%, a difference of 0.23%), Ethiopian (8.6%, a difference of 0.28%), and Turkish (8.6%, a difference of 0.36%). Similarly, the demographic groups most similar to Immigrants from Guatemala are Cree (8.6%, a difference of 0.29%), Albanian (8.6%, a difference of 0.29%), Paraguayan (8.7%, a difference of 0.37%), Shoshone (8.6%, a difference of 0.41%), and Immigrants from Dominican Republic (8.7%, a difference of 0.41%).
| Demographics | Rating | Rank | Unemployment Among Seniors over 75 years |
| Latvians | 80.5 /100 | #152 | Excellent 8.6% |
| Mongolians | 80.1 /100 | #153 | Excellent 8.6% |
| Immigrants | Pakistan | 79.7 /100 | #154 | Good 8.6% |
| Ecuadorians | 78.5 /100 | #155 | Good 8.6% |
| Immigrants | Bahamas | 76.5 /100 | #156 | Good 8.6% |
| Turks | 76.4 /100 | #157 | Good 8.6% |
| Ethiopians | 75.3 /100 | #158 | Good 8.6% |
| Shoshone | 74.6 /100 | #159 | Good 8.6% |
| Cree | 72.8 /100 | #160 | Good 8.6% |
| Albanians | 72.8 /100 | #161 | Good 8.6% |
| Immigrants | South America | 71.3 /100 | #162 | Good 8.6% |
| Immigrants | Guatemala | 68.4 /100 | #163 | Good 8.7% |
| Paraguayans | 62.2 /100 | #164 | Good 8.7% |
| Immigrants | Dominican Republic | 61.4 /100 | #165 | Good 8.7% |
| Immigrants | Belize | 57.6 /100 | #166 | Average 8.7% |
| Immigrants | Eastern Africa | 57.6 /100 | #167 | Average 8.7% |
| Immigrants | Lithuania | 57.2 /100 | #168 | Average 8.7% |
| Fijians | 56.4 /100 | #169 | Average 8.7% |
| Zimbabweans | 54.1 /100 | #170 | Average 8.7% |
| Dominicans | 51.9 /100 | #171 | Average 8.7% |
| Immigrants | Immigrants | 51.8 /100 | #172 | Average 8.7% |