Immigrants from South America vs Armenian Unemployment Among Ages 60 to 64 years
COMPARE
Immigrants from South America
Armenian
Unemployment Among Ages 60 to 64 years
Unemployment Among Ages 60 to 64 years Comparison
Immigrants from South America
Armenians
5.0%
UNEMPLOYMENT AMONG AGES 60 TO 64 YEARS
1.1/ 100
METRIC RATING
246th/ 347
METRIC RANK
5.3%
UNEMPLOYMENT AMONG AGES 60 TO 64 YEARS
0.0/ 100
METRIC RATING
295th/ 347
METRIC RANK
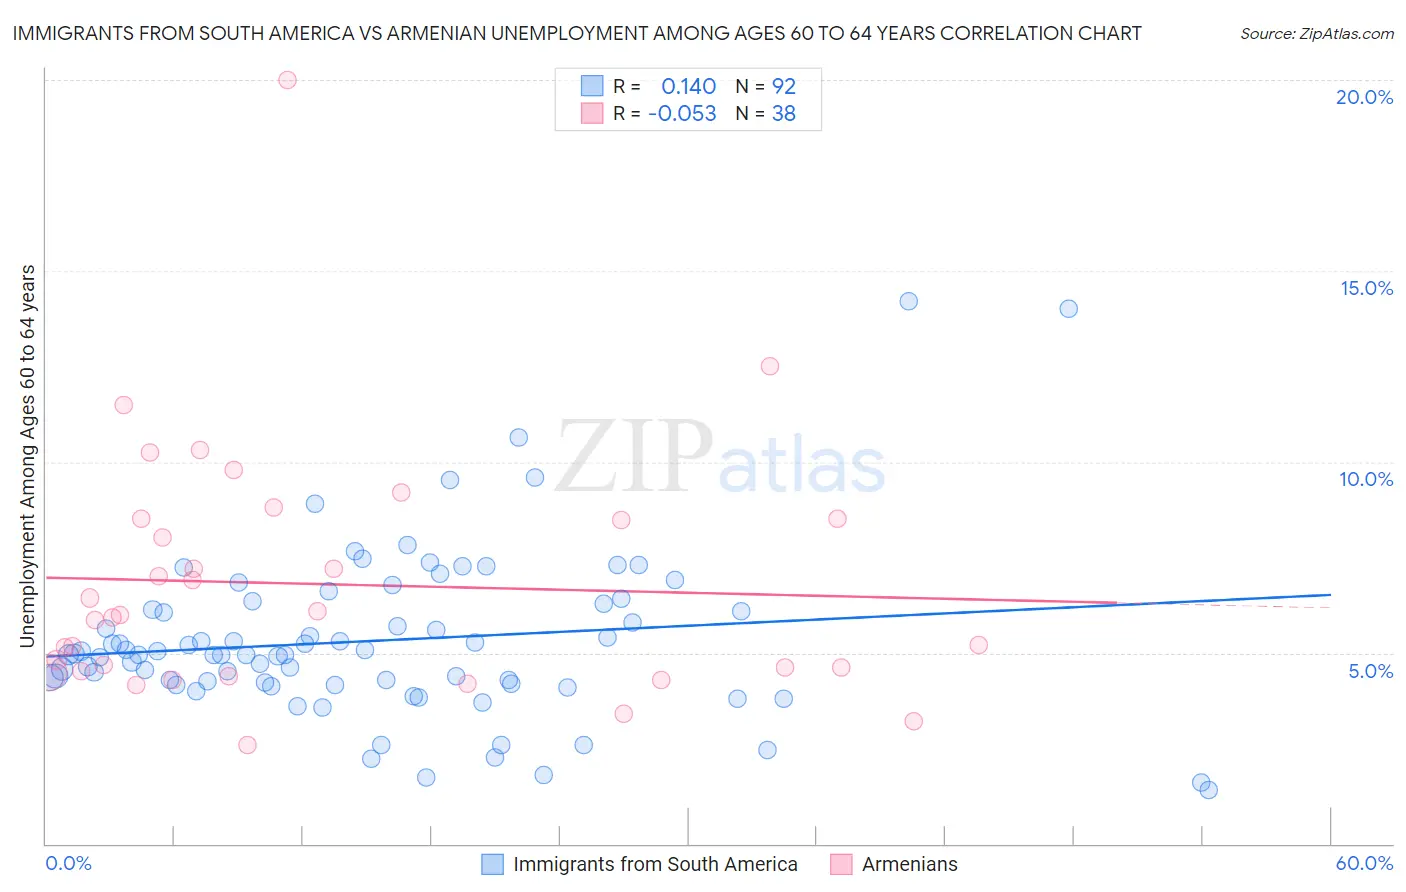
Immigrants from South America vs Armenian Unemployment Among Ages 60 to 64 years Correlation Chart
The statistical analysis conducted on geographies consisting of 426,950,944 people shows a poor positive correlation between the proportion of Immigrants from South America and unemployment rate among population between the ages 60 and 64 in the United States with a correlation coefficient (R) of 0.140 and weighted average of 5.0%. Similarly, the statistical analysis conducted on geographies consisting of 288,355,002 people shows a slight negative correlation between the proportion of Armenians and unemployment rate among population between the ages 60 and 64 in the United States with a correlation coefficient (R) of -0.053 and weighted average of 5.3%, a difference of 5.4%.
Unemployment Among Ages 60 to 64 years Correlation Summary
| Measurement | Immigrants from South America | Armenian |
| Minimum | 1.4% | 2.6% |
| Maximum | 14.2% | 20.0% |
| Range | 12.8% | 17.4% |
| Mean | 5.3% | 6.8% |
| Median | 5.0% | 6.0% |
| Interquartile 25% (IQ1) | 4.2% | 4.5% |
| Interquartile 75% (IQ3) | 6.2% | 8.5% |
| Interquartile Range (IQR) | 2.0% | 4.0% |
| Standard Deviation (Sample) | 2.2% | 3.3% |
| Standard Deviation (Population) | 2.2% | 3.2% |
Similar Demographics by Unemployment Among Ages 60 to 64 years
Demographics Similar to Immigrants from South America by Unemployment Among Ages 60 to 64 years
In terms of unemployment among ages 60 to 64 years, the demographic groups most similar to Immigrants from South America are Immigrants from North Macedonia (5.0%, a difference of 0.0%), Immigrants from Fiji (5.1%, a difference of 0.050%), South American (5.1%, a difference of 0.080%), Comanche (5.0%, a difference of 0.13%), and Immigrants from Cambodia (5.1%, a difference of 0.17%).
| Demographics | Rating | Rank | Unemployment Among Ages 60 to 64 years |
| Ghanaians | 2.4 /100 | #239 | Tragic 5.0% |
| Immigrants | Croatia | 2.2 /100 | #240 | Tragic 5.0% |
| Indians (Asian) | 2.2 /100 | #241 | Tragic 5.0% |
| Argentineans | 2.1 /100 | #242 | Tragic 5.0% |
| Immigrants | Philippines | 1.9 /100 | #243 | Tragic 5.0% |
| Peruvians | 1.6 /100 | #244 | Tragic 5.0% |
| Comanche | 1.3 /100 | #245 | Tragic 5.0% |
| Immigrants | South America | 1.1 /100 | #246 | Tragic 5.0% |
| Immigrants | North Macedonia | 1.1 /100 | #247 | Tragic 5.0% |
| Immigrants | Fiji | 1.1 /100 | #248 | Tragic 5.1% |
| South Americans | 1.0 /100 | #249 | Tragic 5.1% |
| Immigrants | Cambodia | 0.9 /100 | #250 | Tragic 5.1% |
| Immigrants | Uruguay | 0.9 /100 | #251 | Tragic 5.1% |
| Immigrants | Switzerland | 0.9 /100 | #252 | Tragic 5.1% |
| Immigrants | China | 0.9 /100 | #253 | Tragic 5.1% |
Demographics Similar to Armenians by Unemployment Among Ages 60 to 64 years
In terms of unemployment among ages 60 to 64 years, the demographic groups most similar to Armenians are Black/African American (5.3%, a difference of 0.030%), Jamaican (5.3%, a difference of 0.12%), Immigrants from Israel (5.3%, a difference of 0.14%), Immigrants from Latin America (5.3%, a difference of 0.16%), and Hispanic or Latino (5.3%, a difference of 0.18%).
| Demographics | Rating | Rank | Unemployment Among Ages 60 to 64 years |
| Trinidadians and Tobagonians | 0.0 /100 | #288 | Tragic 5.3% |
| Spanish Americans | 0.0 /100 | #289 | Tragic 5.3% |
| Immigrants | Trinidad and Tobago | 0.0 /100 | #290 | Tragic 5.3% |
| Hispanics or Latinos | 0.0 /100 | #291 | Tragic 5.3% |
| Immigrants | Latin America | 0.0 /100 | #292 | Tragic 5.3% |
| Immigrants | Israel | 0.0 /100 | #293 | Tragic 5.3% |
| Blacks/African Americans | 0.0 /100 | #294 | Tragic 5.3% |
| Armenians | 0.0 /100 | #295 | Tragic 5.3% |
| Jamaicans | 0.0 /100 | #296 | Tragic 5.3% |
| Osage | 0.0 /100 | #297 | Tragic 5.4% |
| Immigrants | Central America | 0.0 /100 | #298 | Tragic 5.4% |
| Immigrants | El Salvador | 0.0 /100 | #299 | Tragic 5.4% |
| Immigrants | Barbados | 0.0 /100 | #300 | Tragic 5.4% |
| Immigrants | Jamaica | 0.0 /100 | #301 | Tragic 5.4% |
| Barbadians | 0.0 /100 | #302 | Tragic 5.4% |